Yesterday the price action of WTI made a promising bullish setup.
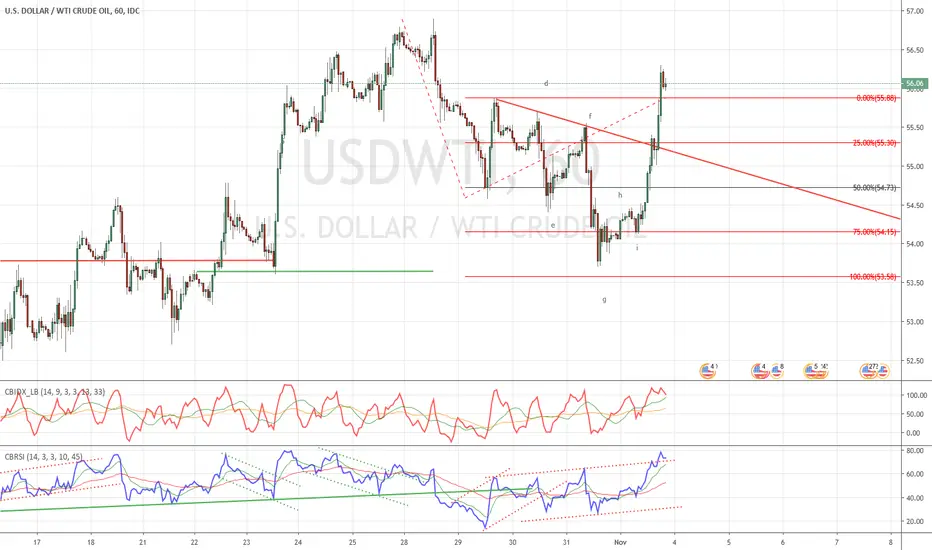
First of all the bearish trend on the hourly chart, which started on October 28th, ended a few cents above the projected price range of $53,58.
Since then a strong opposite bullish price reaction has unfolded which broke many resistances.
Furthermore, the RSI broke out of a descending channel (negative reversal) and reached the 80 area, strengthening the bullish outlook of WTI.
Before getting long you should wait for a price pullback. This will give you the opportunity to calculate the price projections.
Pernyataan Penyangkalan
Informasi dan publikasi tidak dimaksudkan untuk menjadi, dan bukan merupakan saran keuangan, investasi, perdagangan, atau rekomendasi lainnya yang diberikan atau didukung oleh TradingView. Baca selengkapnya di Persyaratan Penggunaan.
Pernyataan Penyangkalan
Informasi dan publikasi tidak dimaksudkan untuk menjadi, dan bukan merupakan saran keuangan, investasi, perdagangan, atau rekomendasi lainnya yang diberikan atau didukung oleh TradingView. Baca selengkapnya di Persyaratan Penggunaan.