1. Overall Trend
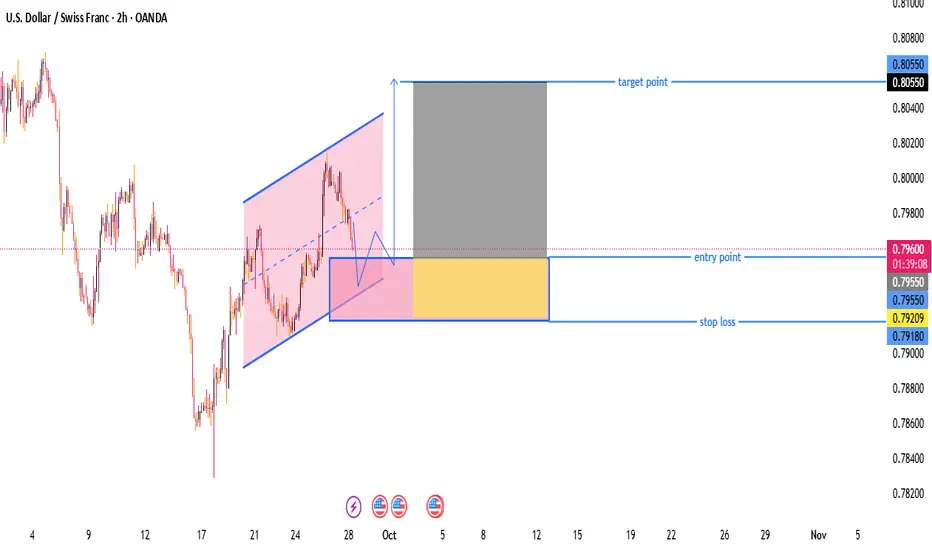
Price had been in a downtrend but recently reversed into a rising channel (highlighted in pink).
The price broke below the lower trendline of the channel, indicating a potential pullback or temporary correction.
2. Chart Pattern & Idea
After breaking the ascending channel, the chart suggests a potential bullish continuation (a breakout-retest strategy).
The drawn pattern shows a pullback to a support zone (highlighted in blue box) where price may bounce.
🟦 Trade Setup
Component Value Comment
Entry Point 0.79596 Current price, just above support zone
Stop Loss 0.79180 Below key support area
Target Point 0.80550 At prior resistance / measured move
✅ Risk/Reward Ratio
Risk: ~41 pips (0.79596 - 0.79180)
Reward: ~95 pips (0.80550 - 0.79596)
R:R Ratio: ~2.3:1 — favorable
📌 Key Technical Observations
Support Zone (Buy Area)
Between 0.79209 and 0.79550, this is a demand zone where price is expected to bounce.
Marked by a consolidation area and minor structure support.
Target Area
0.80550 aligns with a previous high and resistance level.
Also matches a measured move of the previous channel height.
Bullish Confirmation
Price might need to form a higher low or bullish candlestick pattern inside the support zone to validate entry.
⚠️ Potential Risks
If price breaks and closes below 0.79180, it invalidates the bullish thesis.
Market may retest lower support levels or re-enter the downtrend.
USD/CHF is also impacted by USD strength/weakness and Swiss Franc safe-haven flows (watch news).
📈 Summary: Trade Plan
Bias: Bullish
Entry: Buy around 0.79596 (or on bullish confirmation within support zone)
Stop Loss: 0.79180
Take Profit: 0.80550
Risk-Reward: Good (2.3:1)
join my telegram channel t.me/goldmitalteamhttps://t.me/goldmitalteam
Pernyataan Penyangkalan
Informasi dan publikasi tidak dimaksudkan untuk menjadi, dan bukan merupakan saran keuangan, investasi, perdagangan, atau rekomendasi lainnya yang diberikan atau didukung oleh TradingView. Baca selengkapnya di Persyaratan Penggunaan.