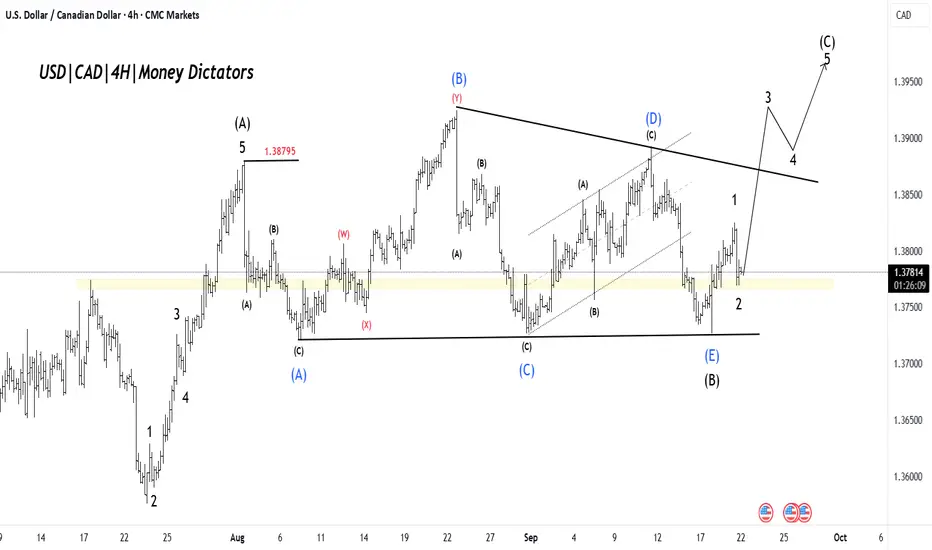
USD/CAD Price is showing the early stages of a bullish (C) leg after a large corrective sequence. The chart labels show a completed corrective (B) low at the horizontal support and an impulsive 1–2 sequence unfolding for the new upward leg. Bias: bullish while price holds above the demand zone/wave-2 low.
The market completed an ABC correction that found support on the horizontal lower boundary. That corrective phase looks finished; we should now be in wave (C) up, the final leg of the correction.
Short-term momentum has flipped, with buyers stepping in at support. This favors trend-following longs into the extension leg (wave 3 → 5)
Target 1 (T1): 1.38408
Target 2 (T2): 1.38810
Stop-Loss (SL): 1.37195
Trading ditutup: target tercapai
Enjoy the profit!To eliminate these delays and give priority access to serious traders, we’ve launched an exclusive Premium EDU + Wave Count Group.
💰 Annual Fee: $115
BUY NOW: t.me/moneydictators/148
Lifetime Free - t.me/moneydictators
💰 Annual Fee: $115
BUY NOW: t.me/moneydictators/148
Lifetime Free - t.me/moneydictators
Publikasi terkait
Pernyataan Penyangkalan
Informasi dan publikasi ini tidak dimaksudkan, dan bukan merupakan, saran atau rekomendasi keuangan, investasi, trading, atau jenis lainnya yang diberikan atau didukung oleh TradingView. Baca selengkapnya di Ketentuan Penggunaan.
To eliminate these delays and give priority access to serious traders, we’ve launched an exclusive Premium EDU + Wave Count Group.
💰 Annual Fee: $115
BUY NOW: t.me/moneydictators/148
Lifetime Free - t.me/moneydictators
💰 Annual Fee: $115
BUY NOW: t.me/moneydictators/148
Lifetime Free - t.me/moneydictators
Publikasi terkait
Pernyataan Penyangkalan
Informasi dan publikasi ini tidak dimaksudkan, dan bukan merupakan, saran atau rekomendasi keuangan, investasi, trading, atau jenis lainnya yang diberikan atau didukung oleh TradingView. Baca selengkapnya di Ketentuan Penggunaan.