Historically, September is usually a poor month for US stock indices but, so far at least, this year it’s different. The US 30 index, which opened the month at 45609, is up around 850 points, trading close to new all time highs of 46465 recorded yesterday (time of writing 0800 BST). That’s a monthly gain of 1.8%.
Some of the reasons for this positive performance lie in last Wednesday’s 25bps (0.25%) interest rate cut from the Federal Reserve (Fed), which included in the accompanying statement the potential for another 2 more 25bps cuts into the end of the year, if the incoming US labour market data suggests it is necessary, and the incoming inflation data is subdued enough to permit it. Two potential sticking points when considering whether this move high can continue.
Looking forward on the scheduled events front, traders receive updates on the health of the US economy in the form of the September Manufacturing and Service activity PMI surveys today at 1445 BST. Any reading above 50 = economic expansion, while below 50 = economic contraction. The focus may be the Services print which has been the main driver of US growth in 2025, with traders comparing Septembers performance against expectations (53) and the strong August print (54.5).
Fed Chairman Powell is also due to speak today on the economic outlook at an event in Warwick at 1735 BST. This could hold the attention of traders later in the day and is an important risk event to be negotiated.
Then, on Friday, the US PCE index is released at 1330 BST. This is the Fed’s preferred inflation gauge and with traders extremely sensitive to the direction of US inflation and its potential knock-on implications for the viability of future Fed interest rate cuts, this update could create extra volatility for the US 30 index into the weekend.
One final consideration for could be the upcoming end of the third quarter on Tuesday September 30th. Q3 has seen the US 30 index gain an impressive 5.2% from opening levels at 44073 on July 1st to 46420 this morning, leading to the question, Could investors decide to lock in these gains over the next 7 trading days or are they happy to hold positions, preparing for a further rally into the end of 2025?
Technical Update: Uptrend Bias Remains In Force
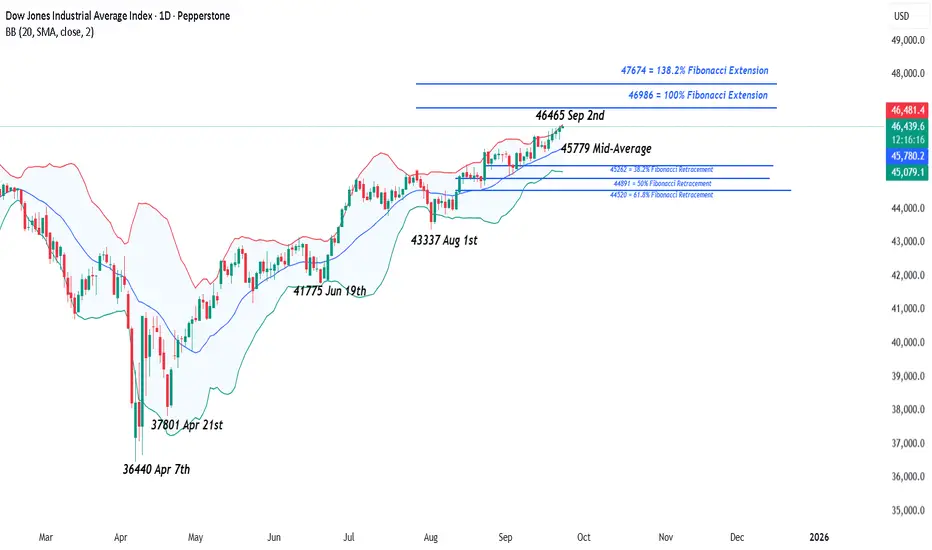
It’s difficult to ignore an asset that consistently posts new all-time highs, which is the case for the US 30 index. As the chart below shows, Monday registered another new upside extreme of 46465.

It could be argued this pattern of higher price highs and higher price lows materialising since the 36440 April 7th downside extreme reflects positive investor sentiment. Traders currently appear happy to pay a higher price each time a sell-off is seen, with this buying support then able to close above resistance marked by the previous high.
This is of course no guarantee that this price action will extend further over coming sessions, but it could mean that assessing what may be the potential support and resistance levels to monitor in the week ahead could be helpful in case an increase in volatility materialises.
Possible Resistance Levels:
Having encountered selling pressure at the 46465 new all-time high on Monday, this level could mark the first resistance focus for the coming week. A closing break above 46465 might well be interpreted by traders as opening scope to maintain the uptrend pattern to higher levels.
Such moves could then see tests of 46986, which is equal to the 100% Fibonacci extension level, and if this gives way, even potentially towards 47674, which is the higher 138.2% extension.
Possible Support Levels:
During the latest phase of the US 30 index advance, it has been the rising Bollinger mid-average that acted as support to price setbacks, limiting declines and enabling the move to resume upside strength. Therefore, with the average currently standing at 45779, this level could well mark the first support focus.
Closing breaks below 45779, if seen, could lead to the possibility of further price declines, opening potential to test the next support at 45262, which is the 38.2% Fibonacci retracement of August to September 2025 price strength (see chart above).
The material provided here has not been prepared accordance with legal requirements designed to promote the independence of investment research and as such is considered to be a marketing communication. Whilst it is not subject to any prohibition on dealing ahead of the dissemination of investment research, we will not seek to take any advantage before providing it to our clients.
Pepperstone doesn’t represent that the material provided here is accurate, current or complete, and therefore shouldn’t be relied upon as such. The information, whether from a third party or not, isn’t to be considered as a recommendation; or an offer to buy or sell; or the solicitation of an offer to buy or sell any security, financial product or instrument; or to participate in any particular trading strategy. It does not take into account readers’ financial situation or investment objectives. We advise any readers of this content to seek their own advice. Without the approval of Pepperstone, reproduction or redistribution of this information isn’t permitted.
Some of the reasons for this positive performance lie in last Wednesday’s 25bps (0.25%) interest rate cut from the Federal Reserve (Fed), which included in the accompanying statement the potential for another 2 more 25bps cuts into the end of the year, if the incoming US labour market data suggests it is necessary, and the incoming inflation data is subdued enough to permit it. Two potential sticking points when considering whether this move high can continue.
Looking forward on the scheduled events front, traders receive updates on the health of the US economy in the form of the September Manufacturing and Service activity PMI surveys today at 1445 BST. Any reading above 50 = economic expansion, while below 50 = economic contraction. The focus may be the Services print which has been the main driver of US growth in 2025, with traders comparing Septembers performance against expectations (53) and the strong August print (54.5).
Fed Chairman Powell is also due to speak today on the economic outlook at an event in Warwick at 1735 BST. This could hold the attention of traders later in the day and is an important risk event to be negotiated.
Then, on Friday, the US PCE index is released at 1330 BST. This is the Fed’s preferred inflation gauge and with traders extremely sensitive to the direction of US inflation and its potential knock-on implications for the viability of future Fed interest rate cuts, this update could create extra volatility for the US 30 index into the weekend.
One final consideration for could be the upcoming end of the third quarter on Tuesday September 30th. Q3 has seen the US 30 index gain an impressive 5.2% from opening levels at 44073 on July 1st to 46420 this morning, leading to the question, Could investors decide to lock in these gains over the next 7 trading days or are they happy to hold positions, preparing for a further rally into the end of 2025?
Technical Update: Uptrend Bias Remains In Force
It’s difficult to ignore an asset that consistently posts new all-time highs, which is the case for the US 30 index. As the chart below shows, Monday registered another new upside extreme of 46465.
It could be argued this pattern of higher price highs and higher price lows materialising since the 36440 April 7th downside extreme reflects positive investor sentiment. Traders currently appear happy to pay a higher price each time a sell-off is seen, with this buying support then able to close above resistance marked by the previous high.
This is of course no guarantee that this price action will extend further over coming sessions, but it could mean that assessing what may be the potential support and resistance levels to monitor in the week ahead could be helpful in case an increase in volatility materialises.
Possible Resistance Levels:
Having encountered selling pressure at the 46465 new all-time high on Monday, this level could mark the first resistance focus for the coming week. A closing break above 46465 might well be interpreted by traders as opening scope to maintain the uptrend pattern to higher levels.
Such moves could then see tests of 46986, which is equal to the 100% Fibonacci extension level, and if this gives way, even potentially towards 47674, which is the higher 138.2% extension.
Possible Support Levels:
During the latest phase of the US 30 index advance, it has been the rising Bollinger mid-average that acted as support to price setbacks, limiting declines and enabling the move to resume upside strength. Therefore, with the average currently standing at 45779, this level could well mark the first support focus.
Closing breaks below 45779, if seen, could lead to the possibility of further price declines, opening potential to test the next support at 45262, which is the 38.2% Fibonacci retracement of August to September 2025 price strength (see chart above).
The material provided here has not been prepared accordance with legal requirements designed to promote the independence of investment research and as such is considered to be a marketing communication. Whilst it is not subject to any prohibition on dealing ahead of the dissemination of investment research, we will not seek to take any advantage before providing it to our clients.
Pepperstone doesn’t represent that the material provided here is accurate, current or complete, and therefore shouldn’t be relied upon as such. The information, whether from a third party or not, isn’t to be considered as a recommendation; or an offer to buy or sell; or the solicitation of an offer to buy or sell any security, financial product or instrument; or to participate in any particular trading strategy. It does not take into account readers’ financial situation or investment objectives. We advise any readers of this content to seek their own advice. Without the approval of Pepperstone, reproduction or redistribution of this information isn’t permitted.
Global risk Warning CFDs are complex instruments and come with a high risk of losing money rapidly due to leverage. Between 74-89% of retail investor accounts lose money when trading in CFDs. You should consider whether you understand how CFD
Pernyataan Penyangkalan
Informasi dan publikasi tidak dimaksudkan untuk menjadi, dan bukan merupakan saran keuangan, investasi, perdagangan, atau rekomendasi lainnya yang diberikan atau didukung oleh TradingView. Baca selengkapnya di Persyaratan Penggunaan.