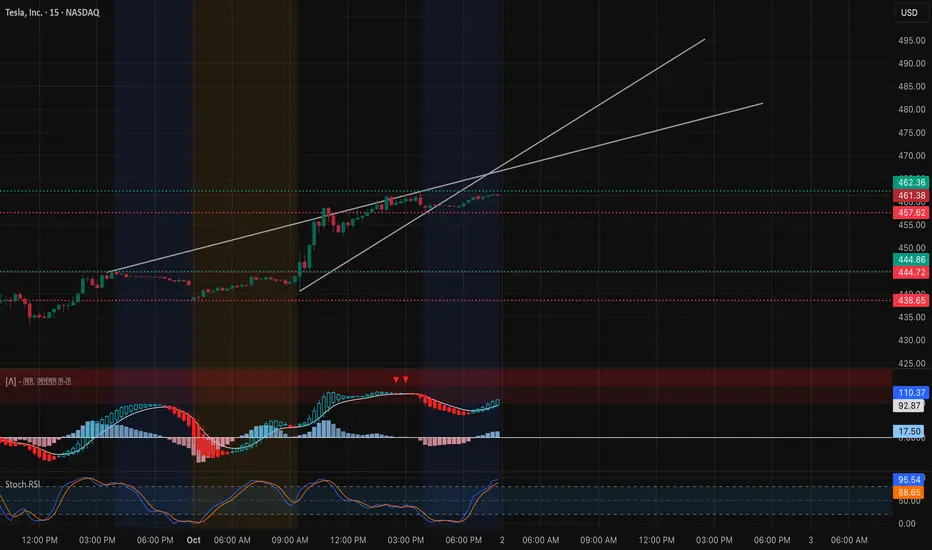
Intraday (15-Min Chart)
Tesla has pushed strongly into the $461–$462 zone, where sellers are starting to show up. On the 15-min chart, price is hugging the upper trendline of the short-term channel. Momentum is extended, but both MACD and Stoch RSI suggest buyers are still pressing their advantage.
* Support levels: $457.5 (near-term pivot) and $452 (channel base).
* Upside trigger: If bulls clear $462.5 with conviction, next upside targets open toward 465–468 intraday.
* Downside risk: Failure to hold $457 risks a pullback to 452–445, where dip-buyers may look to reload.
Bias intraday stays bullish above 457, but stretched oscillators warn of potential rejection if $462 caps the move too strongly.
Options / GEX (1-Hour Chart)

Gamma exposure provides a clear map of where TSLA could move next.
* Call walls: Heavy concentrations sit at 465–470, with $470 acting as the largest resistance zone (gamma ceiling).
* Put walls: Anchored around 432–425, setting downside boundaries.
* Sentiment: Call flow dominates (≈74% bullish options positioning), aligning with recent price momentum.
This paints a classic setup: TSLA is coiling directly beneath the $470 gamma wall. A breakout through 470 could trigger a gamma squeeze toward 475–480, but repeated rejections here trap longs and drag price back into mid-450s.
My Thoughts
For Oct 2, TSLA is at an inflection. I’d favor scalps on dips above $457 targeting 465+ with stops tight under $452. For options traders, a 465–470 call spread lines up well with the gamma map, offering defined risk into resistance. Conversely, if $457 fails, short-term puts targeting 445–448 provide hedge coverage.
Bias: Bullish above 457, but watching $470 as the true breakout line that decides whether momentum continues or stalls.
Tesla has pushed strongly into the $461–$462 zone, where sellers are starting to show up. On the 15-min chart, price is hugging the upper trendline of the short-term channel. Momentum is extended, but both MACD and Stoch RSI suggest buyers are still pressing their advantage.
* Support levels: $457.5 (near-term pivot) and $452 (channel base).
* Upside trigger: If bulls clear $462.5 with conviction, next upside targets open toward 465–468 intraday.
* Downside risk: Failure to hold $457 risks a pullback to 452–445, where dip-buyers may look to reload.
Bias intraday stays bullish above 457, but stretched oscillators warn of potential rejection if $462 caps the move too strongly.
Options / GEX (1-Hour Chart)
Gamma exposure provides a clear map of where TSLA could move next.
* Call walls: Heavy concentrations sit at 465–470, with $470 acting as the largest resistance zone (gamma ceiling).
* Put walls: Anchored around 432–425, setting downside boundaries.
* Sentiment: Call flow dominates (≈74% bullish options positioning), aligning with recent price momentum.
This paints a classic setup: TSLA is coiling directly beneath the $470 gamma wall. A breakout through 470 could trigger a gamma squeeze toward 475–480, but repeated rejections here trap longs and drag price back into mid-450s.
My Thoughts
For Oct 2, TSLA is at an inflection. I’d favor scalps on dips above $457 targeting 465+ with stops tight under $452. For options traders, a 465–470 call spread lines up well with the gamma map, offering defined risk into resistance. Conversely, if $457 fails, short-term puts targeting 445–448 provide hedge coverage.
Bias: Bullish above 457, but watching $470 as the true breakout line that decides whether momentum continues or stalls.
Pernyataan Penyangkalan
The information and publications are not meant to be, and do not constitute, financial, investment, trading, or other types of advice or recommendations supplied or endorsed by TradingView. Read more in the Terms of Use.
Pernyataan Penyangkalan
The information and publications are not meant to be, and do not constitute, financial, investment, trading, or other types of advice or recommendations supplied or endorsed by TradingView. Read more in the Terms of Use.