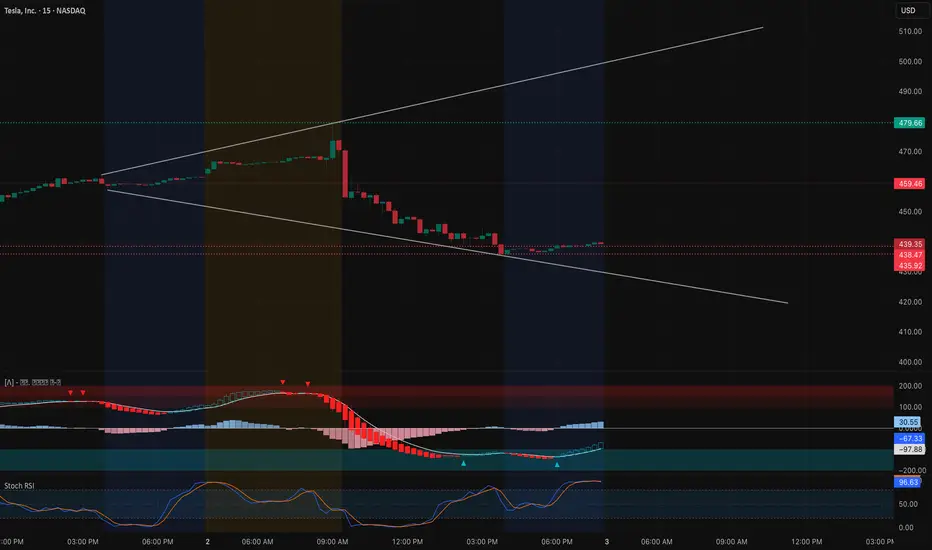
Intraday Technical Outlook (15m Chart)
Tesla (TSLA) saw a sharp selloff, sliding from the mid-$470s to close near $439.35. On the 15-minute chart, the structure is now hugging a descending support line:
* MACD: Still deep in bearish territory but showing early signs of momentum cooling as histogram bars lighten.
* Stoch RSI: Reset from extreme oversold levels, suggesting potential for a relief bounce.
* Key Levels: Immediate support rests around $435–432, with a breakdown exposing $425–420. On the upside, first resistance is $445, followed by a more critical level at $452.5.
Intraday takeaway: Short-term traders should watch if TSLA holds above $435. A sustained bounce can spark a retrace to $445–452, while failure risks another leg lower toward $425.
Options Sentiment & GEX Outlook (1H Chart)

The 1-hour GEX map paints a decisive risk zone for tomorrow’s trade:
* Gamma Walls:
* $452.5–460: Strong call resistance cluster, where sellers likely re-emerge.
* $439.5: Key gamma pivot — trading below this opens up bearish flows.
* $432 / $425 / $420: Heavy put walls acting as magnets if weakness persists.
* Implications:
* Holding above $439.5 can squeeze shorts toward $445–452.5, offering upside for quick calls.
* Losing $435 confirms dealer hedging pressure lower, opening room to $425–420, favoring puts.
* Volatility Context: IVR at 26.9 vs IVx avg 65.2 shows premiums are mid-range but still elevated. This means intraday traders may prefer spreads over outright calls/puts to balance risk/reward.
My Thoughts & Recommendation
For Oct 3 trading, Tesla is sitting right at a critical gamma pivot.
* Intraday (scalping/trading): Look for a bounce play off $435, with upside targets at $445–452 if momentum aligns. A breakdown below $432 favors continuation toward $425–420.
* Options trading (swing/0DTE): Call positions only make sense above $439.5, with tight stops and targets capped near $452. Put strategies (vertical spreads or debit puts) look stronger if price fails at $439.5 and rolls back toward $425.
Bias heading into Oct 3: Cautiously bearish unless $439.5 is reclaimed with volume.
Disclaimer: This analysis is for educational purposes only and does not constitute financial advice. Always conduct your own research and manage risk before trading.
Tesla (TSLA) saw a sharp selloff, sliding from the mid-$470s to close near $439.35. On the 15-minute chart, the structure is now hugging a descending support line:
* MACD: Still deep in bearish territory but showing early signs of momentum cooling as histogram bars lighten.
* Stoch RSI: Reset from extreme oversold levels, suggesting potential for a relief bounce.
* Key Levels: Immediate support rests around $435–432, with a breakdown exposing $425–420. On the upside, first resistance is $445, followed by a more critical level at $452.5.
Intraday takeaway: Short-term traders should watch if TSLA holds above $435. A sustained bounce can spark a retrace to $445–452, while failure risks another leg lower toward $425.
Options Sentiment & GEX Outlook (1H Chart)
The 1-hour GEX map paints a decisive risk zone for tomorrow’s trade:
* Gamma Walls:
* $452.5–460: Strong call resistance cluster, where sellers likely re-emerge.
* $439.5: Key gamma pivot — trading below this opens up bearish flows.
* $432 / $425 / $420: Heavy put walls acting as magnets if weakness persists.
* Implications:
* Holding above $439.5 can squeeze shorts toward $445–452.5, offering upside for quick calls.
* Losing $435 confirms dealer hedging pressure lower, opening room to $425–420, favoring puts.
* Volatility Context: IVR at 26.9 vs IVx avg 65.2 shows premiums are mid-range but still elevated. This means intraday traders may prefer spreads over outright calls/puts to balance risk/reward.
My Thoughts & Recommendation
For Oct 3 trading, Tesla is sitting right at a critical gamma pivot.
* Intraday (scalping/trading): Look for a bounce play off $435, with upside targets at $445–452 if momentum aligns. A breakdown below $432 favors continuation toward $425–420.
* Options trading (swing/0DTE): Call positions only make sense above $439.5, with tight stops and targets capped near $452. Put strategies (vertical spreads or debit puts) look stronger if price fails at $439.5 and rolls back toward $425.
Bias heading into Oct 3: Cautiously bearish unless $439.5 is reclaimed with volume.
Disclaimer: This analysis is for educational purposes only and does not constitute financial advice. Always conduct your own research and manage risk before trading.
Pernyataan Penyangkalan
The information and publications are not meant to be, and do not constitute, financial, investment, trading, or other types of advice or recommendations supplied or endorsed by TradingView. Read more in the Terms of Use.
Pernyataan Penyangkalan
The information and publications are not meant to be, and do not constitute, financial, investment, trading, or other types of advice or recommendations supplied or endorsed by TradingView. Read more in the Terms of Use.