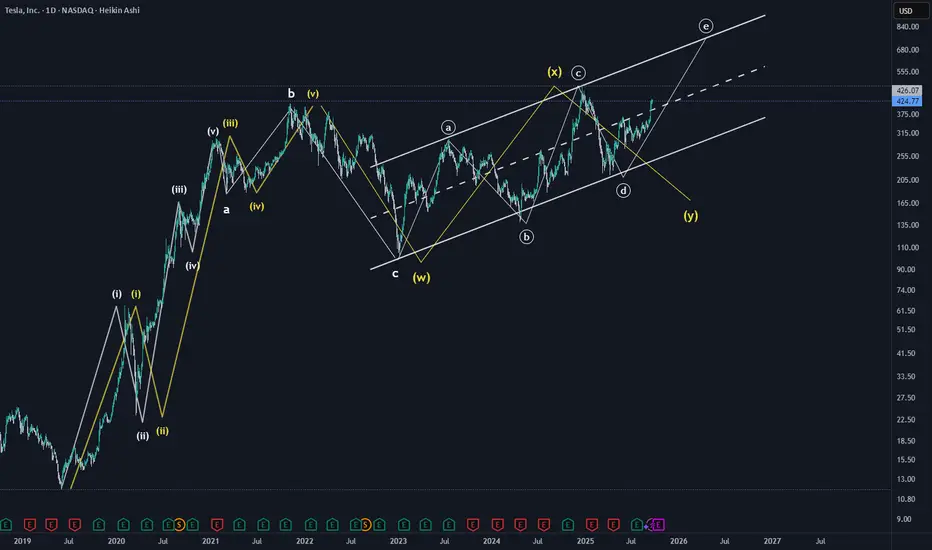
This chart provides a bullish and bearish wave pattern for Tesla. Even though the recent move was very impulsive, both bullish and bearish scenarios are equally possible. This is because the impulsive move seems to be wave C of either X wave or ending diagonal (E of ABCDE).
White represents Bullish scenario and Yellow represents bearish scenario.
Minimum Target reached for the C wave.

Note
**Disclaimer** : All details shared here is for educational purpose only. Please do your own research and consider appropriate risk management before making short term or long-term investment decisions.
Approach Market always with probabilities and make sure risk management in place.
Request your support by like, comment and follow
White represents Bullish scenario and Yellow represents bearish scenario.
Minimum Target reached for the C wave.
Note
**Disclaimer** : All details shared here is for educational purpose only. Please do your own research and consider appropriate risk management before making short term or long-term investment decisions.
Approach Market always with probabilities and make sure risk management in place.
Request your support by like, comment and follow
Catatan
Correction is expected for Bullish scenario as well for the completion of wave A for the ABC within Wave E.Pernyataan Penyangkalan
Informasi dan publikasi tidak dimaksudkan untuk menjadi, dan bukan merupakan saran keuangan, investasi, perdagangan, atau rekomendasi lainnya yang diberikan atau didukung oleh TradingView. Baca selengkapnya di Persyaratan Penggunaan.
Pernyataan Penyangkalan
Informasi dan publikasi tidak dimaksudkan untuk menjadi, dan bukan merupakan saran keuangan, investasi, perdagangan, atau rekomendasi lainnya yang diberikan atau didukung oleh TradingView. Baca selengkapnya di Persyaratan Penggunaan.