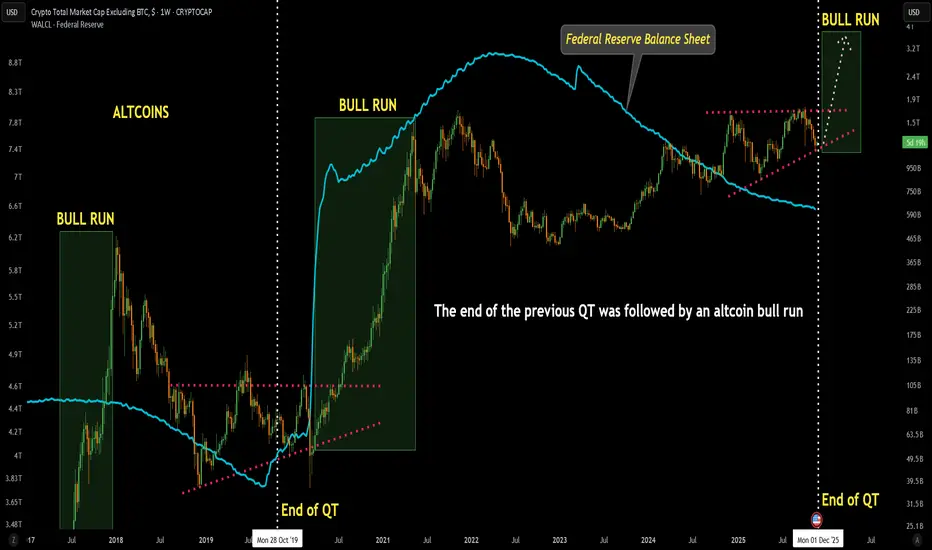
Altcoin Total Market Cap (excluding BTC) with Fed Res Balance Sh
📈 BULLISH BIAS
My Strong Bias Based on This Chart:
Altcoins are setting up for a massive macro breakout sometime after QT ends, likely aligning with 2025/2026 liquidity expansion.
✔ Ascending triangle at macro scale
✔ Higher lows for 3+ years
✔ Liquidity cycle bottoming
✔ Historical repeatability
✔ Market cap still below all-time-high resistance
This is a textbook accumulation → expansion setup.
Bullish Scenario
If the pattern breaks the 1.6–1.8T resistance:
Altcoin market cap could rise to 3–4T in the next macro wave
Strongest rallies likely in high-beta alts (Layer 1s, AI, RWA, gaming, DePIN)
📌 This aligns with the historical 2–3× expansions after QT ends.
Timing:
This chart places the next projected end of QT around Dec 2025, aligning with:
Falling inflation
Slowing economy
Future liquidity cycle turning
Expected rate cuts cycle (market pricing 2025 pivot)
This adds macro confirmation to a bullish thesis.
📉 Bearish Scenario (Risk Factors)
A bearish shift happens if:
Macro conditions worsen dramatically
Fed delays the liquidity pivot
Breaks the ascending support (~1.1T)
This would push altcoins into a deeper consolidation.
But based on liquidity trends, this is less likely.
🎯 Final Bias
The chart is strongly bullish.
Altcoins are compressing inside a macro ascending triangle, and historical patterns show a massive bull run begins when QT ends. My projection for a Dec 2025–2026 altcoin explosion is highly aligned with macro liquidity cycles.
This is one of the strongest macro setups for altcoins we’ve had in years.
Pernyataan Penyangkalan
Informasi dan publikasi ini tidak dimaksudkan, dan bukan merupakan, saran atau rekomendasi keuangan, investasi, trading, atau jenis lainnya yang diberikan atau didukung oleh TradingView. Baca selengkapnya di Ketentuan Penggunaan.
Pernyataan Penyangkalan
Informasi dan publikasi ini tidak dimaksudkan, dan bukan merupakan, saran atau rekomendasi keuangan, investasi, trading, atau jenis lainnya yang diberikan atau didukung oleh TradingView. Baca selengkapnya di Ketentuan Penggunaan.