TFCILTD - Massive Cup & Handle Breakout | Daily Chart
📊 TFCILTD – Massive Cup & Handle Breakout | Fib 100% Retest | RSI Overbought | Volume Surge | Daily Chart
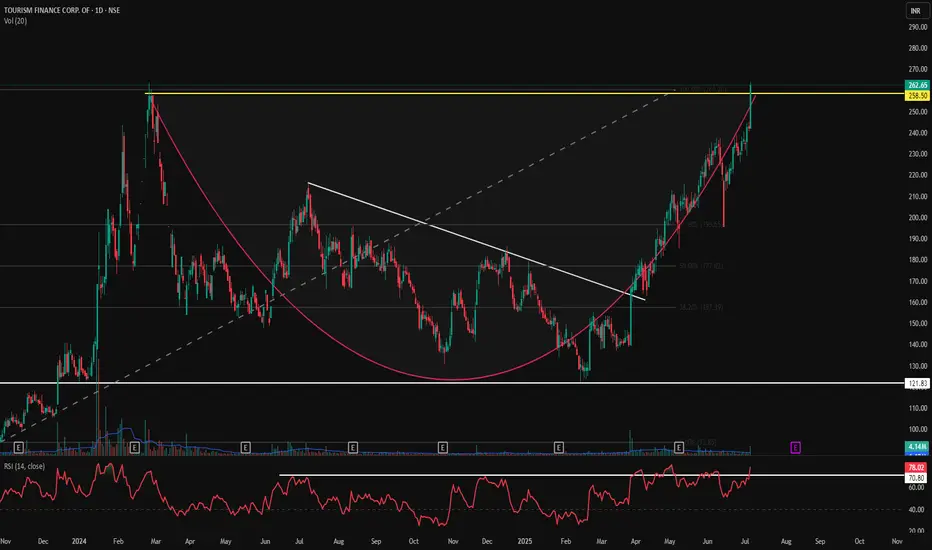
📅 Chart Date: July 6, 2025
📍 CMP: ₹262.65 (+8.48%)
📈 Symbol: NSE:TFCILTD
🔍 Technical Analysis Summary
☕ Cup & Handle Pattern Breakout
Price broke out above the Cup & Handle neckline near ₹258.50 and hit the Fibonacci 100% extension at ₹262.65.
Clean rounding bottom formation visible, followed by bullish handle and sharp breakout.
📐 Fibonacci Retracement (from swing low ₹93.85 to high ₹262.65)
50.00% – ₹177.02
61.80% – ₹196.65
✅ 100.00% – ₹262.65 (just achieved!)
📈 RSI Indicator (14)
RSI at 78.02, clearly in overbought territory – indicating momentum strength, but a minor pullback is likely.
RSI consistently above 70 for the past few sessions reflects strong trend continuation.
📊 Volume
Volume surged to 4.14M, supporting the breakout. Confirmation of pattern breakout is validated by this volume spike.
🏁 Key Technical Levels
Breakout Zone (Neckline): ₹258.50 ✅
CMP: ₹262.65
Next Resistance: Blue Sky Zone (New Highs)
Support on Retest: ₹258.50 → ₹230.67
Major Support: ₹177.02 (Fib 50%)
💡 Trade Setup Idea
Entry: On breakout confirmation above ₹258.50 or on retest
Stoploss: Below ₹230
Target: Open sky above ₹262 → Trend-following zone
Risk Level: Medium-High (due to overbought RSI)
⚠️ Disclaimer: This is an educational chart setup and not trading advice. Please conduct your own research and risk management.
📣 Follow @PriceAction_Pulse for more such clean breakouts and chart pattern analysis!
🔁 Drop a comment if TFCILTD is on your radar for the next breakout rally 📈
Trading ditutup: target tercapai
The first Sky Zone resistance level has been touched.Pernyataan Penyangkalan
Informasi dan publikasi tidak dimaksudkan untuk menjadi, dan bukan merupakan saran keuangan, investasi, perdagangan, atau rekomendasi lainnya yang diberikan atau didukung oleh TradingView. Baca selengkapnya di Persyaratan Penggunaan.
Pernyataan Penyangkalan
Informasi dan publikasi tidak dimaksudkan untuk menjadi, dan bukan merupakan saran keuangan, investasi, perdagangan, atau rekomendasi lainnya yang diberikan atau didukung oleh TradingView. Baca selengkapnya di Persyaratan Penggunaan.