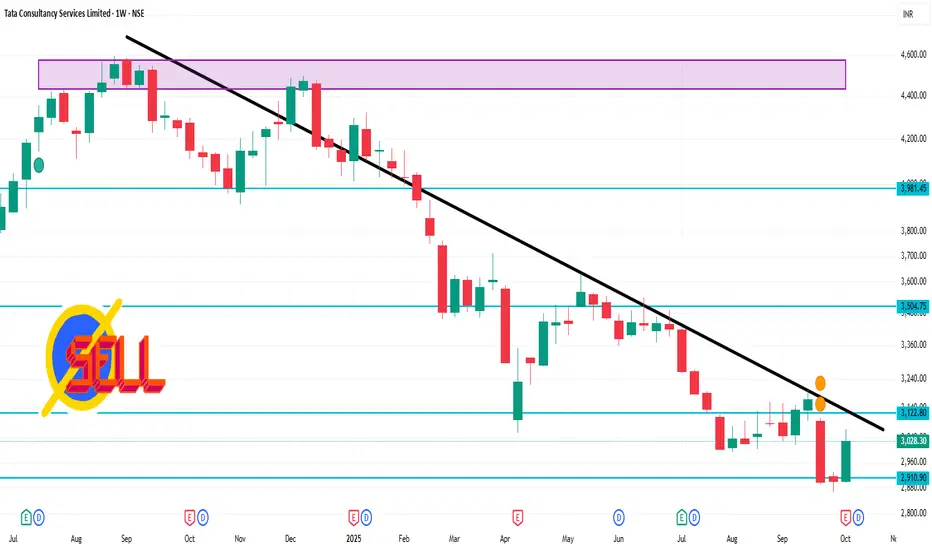
Weekly Technical Overview
Current Price: ₹3,028.30 on the NSE
52-Week Range: ₹2,866.60 – ₹4,494.90
Volume: Approximately 8.8 million shares traded this week
VWAP: ₹3,032.15
Market Cap: ₹1.095 trillion
Beta: 0.97 (indicating moderate volatility
🔍 Key Technical Indicators
Moving Averages: TCS is trading below its 200-day moving average, suggesting a bearish trend.
RSI: The Relative Strength Index is in the neutral zone, indicating balanced buying and selling pressures.
MACD: The Moving Average Convergence Divergence is showing a bearish crossover, which may signal a potential downward movement.
📈 Outlook
Support Levels: Immediate support is observed around ₹2,950, with a stronger support zone near ₹2,870.
Resistance Levels: Key resistance is at ₹3,100, followed by ₹3,200.
Volatility: The stock's beta of 0.97 suggests that it moves in line with the broader market, with moderate volatility.
Publikasi terkait
Pernyataan Penyangkalan
Informasi dan publikasi ini tidak dimaksudkan, dan bukan merupakan, saran atau rekomendasi keuangan, investasi, trading, atau jenis lainnya yang diberikan atau didukung oleh TradingView. Baca selengkapnya di Ketentuan Penggunaan.
Publikasi terkait
Pernyataan Penyangkalan
Informasi dan publikasi ini tidak dimaksudkan, dan bukan merupakan, saran atau rekomendasi keuangan, investasi, trading, atau jenis lainnya yang diberikan atau didukung oleh TradingView. Baca selengkapnya di Ketentuan Penggunaan.