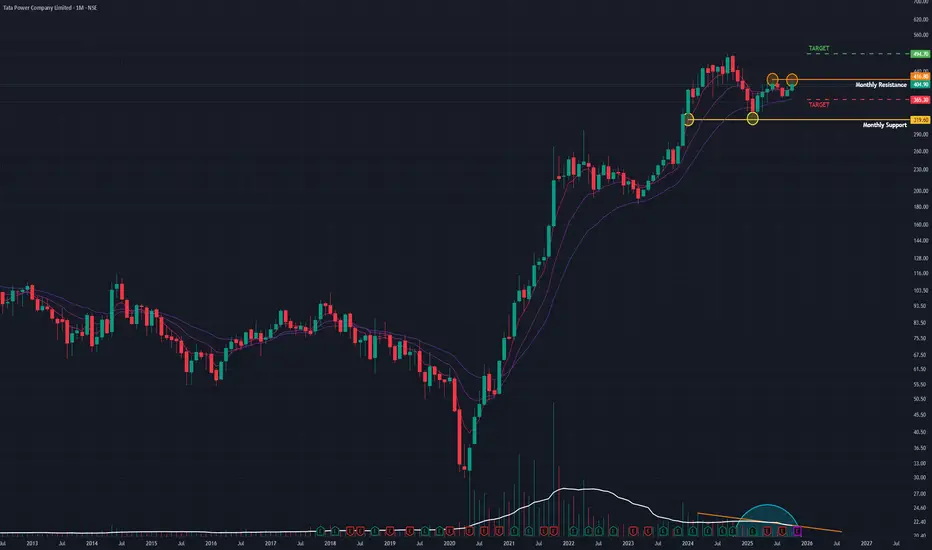
Tata Power is displaying a classic and very clean technical setup. After its parabolic run to an All-Time High (ATH) in September 2024 (around ₹490), the stock has entered a healthy, multi-month sideways consolidation. This is a bullish "coiling spring" or "accumulation" pattern.
📊 The Technicals
1. The Range (The "Box"):
The battle lines are clearly drawn.
- Resistance: A strong horizontal supply zone at the ATH, around ₹405 - ₹415.
- Support: A firm demand zone and the bottom of the range at ₹365.
2. Volume is Key:
The most bullish signal here is the volume contraction. Throughout this sideways "box," the volume has been drying up. This indicates that sellers are becoming scarce, and the stock is being absorbed by buyers in preparation for the next move.
3. Momentum Indicators:
- EMAs: Short-term EMAs are in a "PCO" (Price Crossover) state, showing bullish momentum.
- RSI: The RSI is rising, indicating that buying strength is building up under the surface.
4. Recent Price Action:
The surge in October (+4.18% on high volume) was an attempt to break this resistance. It failed, which confirms that the ₹415 level is a formidable barrier that will require significant volume to overcome.
🎯 The Scenarios
This is a "wait and watch" setup where we let the price tell us what to do next.
- 🐂 THE BULLISH CASE (Trigger)
I am watching for a decisive daily close above the ₹415 resistance level. This must be accompanied by a high-volume spike (higher than the October attempt) to confirm that the supply has finally been absorbed.
- Target 1: ₹490 .
- Next Target: Price discovery.
- 🐻 THE BEARISH CASE (Invalidation)
If the stock fails to break out and instead breaks down with conviction, the setup is invalidated.
- Trigger: A daily close below the ₹365 support level.
- Target: A deeper correction.
Conclusion:
The indicators and volume profile suggest a bullish resolution. The stock is coiling, and the pressure is building. The smart money is waiting for the high-volume breakout above ₹415 for confirmation.
Disclaimer: This analysis is my personal view & for educational purposes only. They shall not be construed as trade or investment advice. Before making any financial decision, it is imperative that you consult with a qualified financial professional.
Pernyataan Penyangkalan
Informasi dan publikasi ini tidak dimaksudkan, dan bukan merupakan, saran atau rekomendasi keuangan, investasi, trading, atau jenis lainnya yang diberikan atau didukung oleh TradingView. Baca selengkapnya di Ketentuan Penggunaan.