📊 Weekly Support & Resistance – Current Levels
Resistance Levels (Upside Targets)
R1: ~₹1,182 – first weekly resistance zone.
R2: ~₹1,200 – medium resistance.
R3: ~₹1,212–₹1,218 – higher resistance cluster.
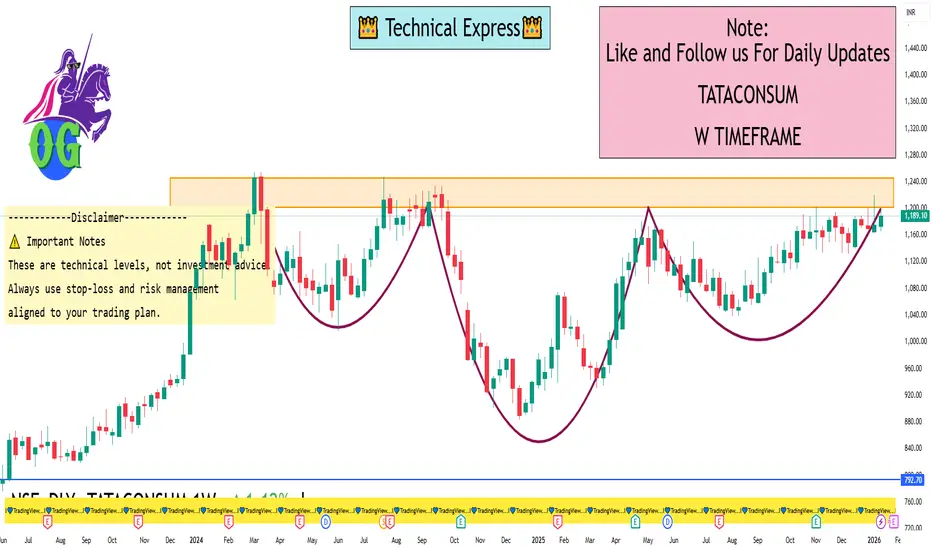
Major weekly zone: ~₹1,243–₹1,265 – extended upside possible if breakout happens.
Support Levels (Downside Levels)
S1: ~₹1,152–₹1,153 – primary weekly support.
S2: ~₹1,131 – next support zone.
S3: ~₹1,097 – deeper support if S2 breaks.
Lower supports: ~₹1,136–₹1,151 cluster from other pivots.
📌 Weekly Pivot Reference (Live-ish)
Current price is around ₹1,185–₹1,190 region, indicating the balance zone for the week.
📈 How to Use These Levels This Week
Bullish Scenario
A sustained move above ₹1,200 → could accelerate toward ₹1,212–₹1,218 and then ₹1,243+.
Hold above ₹1,182 keeps near-term upside intact.
Bearish Scenario
A break below ₹1,152 → could see correction down to ₹1,131 & ₹1,097.
Weekly close below ₹1,131 may signal deeper selling.
Neutral/Range
If price stays between ₹1,152–₹1,200 → we could see consolidation before a breakout direction.
🧠 Additional Current Indicators (Context)
RSI & SMA readings on daily suggest neutral to mixed momentum, not extreme overbought/oversold.
Moving averages around 1,180–1,171 zones give overlapping support confluence.
⚠️ Important Notes
These are technical levels, not investment advice.
Weekly levels are based on recent technical support/resistance analysis — actual prices may vary intra-session.
Always use stop-loss and risk management aligned to your trading plan.
Resistance Levels (Upside Targets)
R1: ~₹1,182 – first weekly resistance zone.
R2: ~₹1,200 – medium resistance.
R3: ~₹1,212–₹1,218 – higher resistance cluster.
Major weekly zone: ~₹1,243–₹1,265 – extended upside possible if breakout happens.
Support Levels (Downside Levels)
S1: ~₹1,152–₹1,153 – primary weekly support.
S2: ~₹1,131 – next support zone.
S3: ~₹1,097 – deeper support if S2 breaks.
Lower supports: ~₹1,136–₹1,151 cluster from other pivots.
📌 Weekly Pivot Reference (Live-ish)
Current price is around ₹1,185–₹1,190 region, indicating the balance zone for the week.
📈 How to Use These Levels This Week
Bullish Scenario
A sustained move above ₹1,200 → could accelerate toward ₹1,212–₹1,218 and then ₹1,243+.
Hold above ₹1,182 keeps near-term upside intact.
Bearish Scenario
A break below ₹1,152 → could see correction down to ₹1,131 & ₹1,097.
Weekly close below ₹1,131 may signal deeper selling.
Neutral/Range
If price stays between ₹1,152–₹1,200 → we could see consolidation before a breakout direction.
🧠 Additional Current Indicators (Context)
RSI & SMA readings on daily suggest neutral to mixed momentum, not extreme overbought/oversold.
Moving averages around 1,180–1,171 zones give overlapping support confluence.
⚠️ Important Notes
These are technical levels, not investment advice.
Weekly levels are based on recent technical support/resistance analysis — actual prices may vary intra-session.
Always use stop-loss and risk management aligned to your trading plan.
I built a Buy & Sell Signal Indicator with 85% accuracy.
📈 Get access via DM or
WhatsApp: wa.link/d997q0
Contact - +91 76782 40962
| Email: techncialexpress@gmail.com
| Script Coder | Trader | Investor | From India
📈 Get access via DM or
WhatsApp: wa.link/d997q0
Contact - +91 76782 40962
| Email: techncialexpress@gmail.com
| Script Coder | Trader | Investor | From India
Publikasi terkait
Pernyataan Penyangkalan
Informasi dan publikasi ini tidak dimaksudkan, dan bukan merupakan, saran atau rekomendasi keuangan, investasi, trading, atau jenis lainnya yang diberikan atau didukung oleh TradingView. Baca selengkapnya di Ketentuan Penggunaan.