19-JUL
pretiming.com/2019/04/at-nyse-t-stock-price-forecast-timing.html
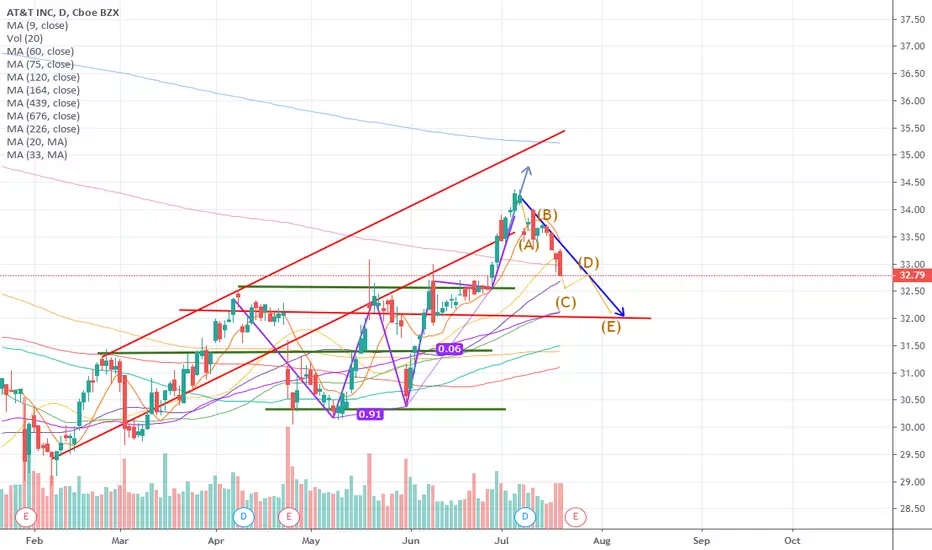
Investing position: In Falling section of high risk & low profit
S&D strength Trend: In the midst of a downward trend of strong downward momentum price flow marked by temporary rises and strong falls.
Today's S&D strength Flow: Supply-Demand strength has changed from a weak selling flow to a strengthening selling flow again.
Forecast D+1 Candlestick Color : RED Candlestick
%D+1 Range forecast: 0.5% (HIGH) ~ -0.6% (LOW), -0.1% (CLOSE)
%AVG in case of rising: 1.0% (HIGH) ~ -0.4% (LOW), 0.6% (CLOSE)
%AVG in case of falling: 0.3% (HIGH) ~ -1.1% (LOW), -0.8% (CLOSE)
pretiming.com/2019/04/at-nyse-t-stock-price-forecast-timing.html
Investing position: In Falling section of high risk & low profit
S&D strength Trend: In the midst of a downward trend of strong downward momentum price flow marked by temporary rises and strong falls.
Today's S&D strength Flow: Supply-Demand strength has changed from a weak selling flow to a strengthening selling flow again.
Forecast D+1 Candlestick Color : RED Candlestick
%D+1 Range forecast: 0.5% (HIGH) ~ -0.6% (LOW), -0.1% (CLOSE)
%AVG in case of rising: 1.0% (HIGH) ~ -0.4% (LOW), 0.6% (CLOSE)
%AVG in case of falling: 0.3% (HIGH) ~ -1.1% (LOW), -0.8% (CLOSE)
Pernyataan Penyangkalan
Informasi dan publikasi ini tidak dimaksudkan, dan bukan merupakan, saran atau rekomendasi keuangan, investasi, trading, atau jenis lainnya yang diberikan atau didukung oleh TradingView. Baca selengkapnya di Ketentuan Penggunaan.
Pernyataan Penyangkalan
Informasi dan publikasi ini tidak dimaksudkan, dan bukan merupakan, saran atau rekomendasi keuangan, investasi, trading, atau jenis lainnya yang diberikan atau didukung oleh TradingView. Baca selengkapnya di Ketentuan Penggunaan.