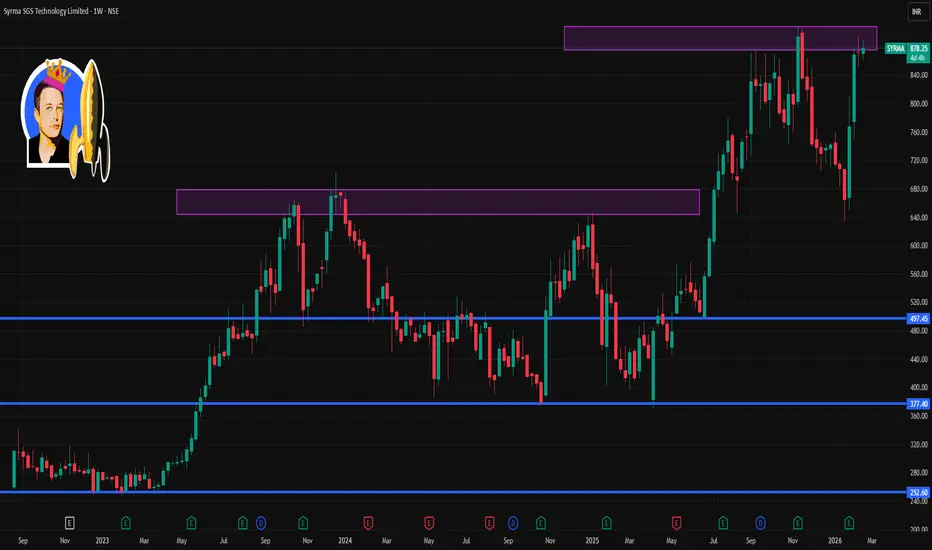
📌 Current Price: ~₹872–₹878 on NSE (recent trading range).
📈 Weekly Technical Levels (Support & Resistance)
🔹 Resistance Levels
R1: ~₹876 – immediate short-term upside hurdle (near recent high).
R2: ~₹892 – next resistance zone where selling pressure can appear.
R3: ~₹916 – bullish breakout target if price sustains above R2.
🔸 Pivot / Neutral Zone
Weekly Pivot ~₹849–₹873 area – this zone acts as reference for bullish vs bearish bias:
– Above pivot → bias turns mildly bullish
– Below pivot → bias is neutral/weak
🔻 Support Levels
S1: ~₹834 – first key support on weekly frame.
S2: ~₹806 – stronger downside support zone if S1 breaks.
S3: ~₹791 – deeper support level (next major cushion).
📊 These are the key weekly price barriers based on recent pivot and volume nodes — they help you gauge where buyers/sellers might step in over the next 5–7 days.
🧠 Short-Term Technical Context
Trend: Around range-bound to slightly bullish in the very short term — recent price is near weekly pivot/resistance area.
👉 Sustained break above ~₹892 would suggest momentum toward higher weekly levels (₹900+)
👉 Breakdown below ~₹806 could tilt short-term bias bearish.
Note: True weekly pivots adjust each trading week; the above is latest near-term reference based on technical sources.
Publikasi terkait
Pernyataan Penyangkalan
Informasi dan publikasi ini tidak dimaksudkan, dan bukan merupakan, saran atau rekomendasi keuangan, investasi, trading, atau jenis lainnya yang diberikan atau didukung oleh TradingView. Baca selengkapnya di Ketentuan Penggunaan.
Publikasi terkait
Pernyataan Penyangkalan
Informasi dan publikasi ini tidak dimaksudkan, dan bukan merupakan, saran atau rekomendasi keuangan, investasi, trading, atau jenis lainnya yang diberikan atau didukung oleh TradingView. Baca selengkapnya di Ketentuan Penggunaan.