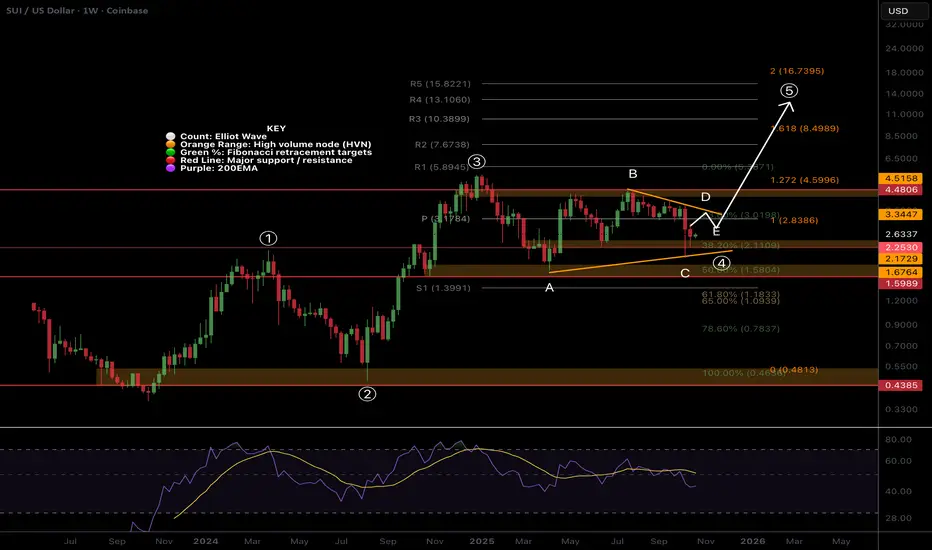
Wave (5) has a minimum target of the R5 weekly pivot at $15.8, at the 2 Fibonacci extension.
Falling below $1.7, wave A, invalidates the analysis and suggests we have much lower to go in a bear market.
Weekly RSI is bearish with lower to go but hidden bullish divergence has formed, a good raly will confirm.
SUI i holding up better than most with shallower retracements overall.
Safe trading
PhD Cand: Investing, Sentiment & Social Mood, MSc Financial Econ
Technical Analyst 8 years, Trader/Investor 15 years
Market Breakdown & Alpha Reports: detrended.substack.com
Earn & Learn Trade Planning & Signals (FREE WEEK): tradesignals.substack.com
Technical Analyst 8 years, Trader/Investor 15 years
Market Breakdown & Alpha Reports: detrended.substack.com
Earn & Learn Trade Planning & Signals (FREE WEEK): tradesignals.substack.com
Publikasi terkait
Pernyataan Penyangkalan
Informasi dan publikasi tidak dimaksudkan untuk menjadi, dan bukan merupakan saran keuangan, investasi, perdagangan, atau rekomendasi lainnya yang diberikan atau didukung oleh TradingView. Baca selengkapnya di Persyaratan Penggunaan.