SPY Friday Setup – Bears Take Control Below $662 as Gamma Turns Negative ⚠️”
📊 Multi-Timeframe Breakdown
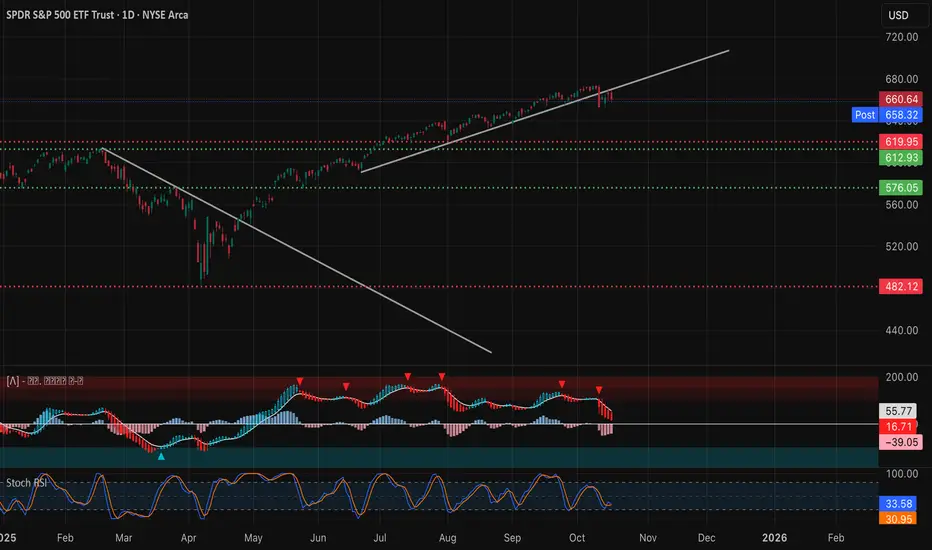
🕒 1. Daily Chart – Macro Structure (“The Why”)
SPY continues to lose grip at the upper trend channel, printing its third consecutive red daily candle and officially breaking below the short-term rising trendline that’s guided price since April. The breakdown below $662–$665 confirms a near-term shift in momentum from bullish to neutral-bearish.
MACD shows a clear bearish crossover, with histogram momentum building to the downside. Stoch RSI sits near the lower band, but not yet oversold — implying more room for a grind-down before a proper bounce.
Macro Bias: Momentum fading; corrective wave likely unfolding toward key supports at $650 → $620 unless bulls reclaim $665.
Key Levels:
* Resistance: $662 → $670 → $682
* Support: $658 → $650 → $620
⏰ 2. 1-Hour Chart – Active Market Structure (“The Setup”)

The 1H structure highlights a CHoCH confirmation near $662, with a decisive BOS to the downside that opened a new lower-low pattern. Price retested the underside of the broken channel around $662–$664, rejected cleanly, and now trades below the intraday trendline — a bearish continuation setup.
MACD remains deep in negative territory, while Stoch RSI has reset near zero, suggesting sellers still control short-term momentum. A recovery into $662–$664 may offer a fade setup if buyers fail to break above that zone with volume.
Key Levels:
* Resistance: $662 → $665 → $670
* Support: $655 → $650 → $645
💹 3. 15-Minute Chart – Intraday Execution (“The How”)

On the 15-minute timeframe, SPY shows a tight descending channel with multiple CHoCH → BOS prints confirming lower-high structure. The MACD histogram has slightly flattened near zero, indicating short-term indecision after extended downside. Meanwhile, Stoch RSI is curling upward from oversold — suggesting a brief relief bounce before sellers step in again.
If price holds below $662, every rally into $660–$663 remains a short opportunity zone.
Scalp Plan:
* Bearish Scenario: Enter below $658, target $654 → $650, stop above $662.5
* Bullish Scenario: Flip long only on confirmed reclaim above $665, target $670, stop below $661
Volume spikes show heavy positioning around $660 — a battle zone likely to dictate the next leg.
📈 4. GEX (Gamma Exposure) Chart – Dealer Positioning (“The Fuel”)

Gamma flow data shows a bearish dealer setup, with highest negative NETGEX and PUT support now anchored near $660. Dealers are short gamma — meaning volatility expansion can accelerate in either direction, but the bias is currently to the downside.
* Gamma Flip Zone: $662
* Highest Negative GEX / Put Wall: $660 (active support magnet)
* Second Put Wall: $656 → $654
* Call Resistance: $662 → $665
* IVR: 36.3 | IVx avg: 24.3 | Put flow: 145.1% dominant
The gamma structure implies dealers are hedging aggressively below $660, which can amplify intraday drops if $658 fails. Until SPY reclaims $662+, market makers’ hedging flows remain bearish.
🎯 Final Outlook
SPY’s technical structure and gamma setup both favor a bearish-to-neutral bias heading into Friday. The key battleground sits between $658–$662 — a zone where intraday liquidity repeatedly flips.
If $662 holds as resistance, expect continued downside toward $654–$650, where gamma exposure may stabilize. A sharp reclaim of $665 would invalidate the short setup and shift sentiment back toward range recovery.
Watch for a fake breakout above $662 early Friday followed by rejection — a classic “trap and drop” scenario that aligns with the current gamma map.
Disclaimer: This analysis is for educational purposes only and not financial advice. Always do your own research and manage your risk carefully.
📊 Multi-Timeframe Breakdown
🕒 1. Daily Chart – Macro Structure (“The Why”)
SPY continues to lose grip at the upper trend channel, printing its third consecutive red daily candle and officially breaking below the short-term rising trendline that’s guided price since April. The breakdown below $662–$665 confirms a near-term shift in momentum from bullish to neutral-bearish.
MACD shows a clear bearish crossover, with histogram momentum building to the downside. Stoch RSI sits near the lower band, but not yet oversold — implying more room for a grind-down before a proper bounce.
Macro Bias: Momentum fading; corrective wave likely unfolding toward key supports at $650 → $620 unless bulls reclaim $665.
Key Levels:
* Resistance: $662 → $670 → $682
* Support: $658 → $650 → $620
⏰ 2. 1-Hour Chart – Active Market Structure (“The Setup”)
The 1H structure highlights a CHoCH confirmation near $662, with a decisive BOS to the downside that opened a new lower-low pattern. Price retested the underside of the broken channel around $662–$664, rejected cleanly, and now trades below the intraday trendline — a bearish continuation setup.
MACD remains deep in negative territory, while Stoch RSI has reset near zero, suggesting sellers still control short-term momentum. A recovery into $662–$664 may offer a fade setup if buyers fail to break above that zone with volume.
Key Levels:
* Resistance: $662 → $665 → $670
* Support: $655 → $650 → $645
💹 3. 15-Minute Chart – Intraday Execution (“The How”)
On the 15-minute timeframe, SPY shows a tight descending channel with multiple CHoCH → BOS prints confirming lower-high structure. The MACD histogram has slightly flattened near zero, indicating short-term indecision after extended downside. Meanwhile, Stoch RSI is curling upward from oversold — suggesting a brief relief bounce before sellers step in again.
If price holds below $662, every rally into $660–$663 remains a short opportunity zone.
Scalp Plan:
* Bearish Scenario: Enter below $658, target $654 → $650, stop above $662.5
* Bullish Scenario: Flip long only on confirmed reclaim above $665, target $670, stop below $661
Volume spikes show heavy positioning around $660 — a battle zone likely to dictate the next leg.
📈 4. GEX (Gamma Exposure) Chart – Dealer Positioning (“The Fuel”)
Gamma flow data shows a bearish dealer setup, with highest negative NETGEX and PUT support now anchored near $660. Dealers are short gamma — meaning volatility expansion can accelerate in either direction, but the bias is currently to the downside.
* Gamma Flip Zone: $662
* Highest Negative GEX / Put Wall: $660 (active support magnet)
* Second Put Wall: $656 → $654
* Call Resistance: $662 → $665
* IVR: 36.3 | IVx avg: 24.3 | Put flow: 145.1% dominant
The gamma structure implies dealers are hedging aggressively below $660, which can amplify intraday drops if $658 fails. Until SPY reclaims $662+, market makers’ hedging flows remain bearish.
🎯 Final Outlook
SPY’s technical structure and gamma setup both favor a bearish-to-neutral bias heading into Friday. The key battleground sits between $658–$662 — a zone where intraday liquidity repeatedly flips.
If $662 holds as resistance, expect continued downside toward $654–$650, where gamma exposure may stabilize. A sharp reclaim of $665 would invalidate the short setup and shift sentiment back toward range recovery.
Watch for a fake breakout above $662 early Friday followed by rejection — a classic “trap and drop” scenario that aligns with the current gamma map.
Disclaimer: This analysis is for educational purposes only and not financial advice. Always do your own research and manage your risk carefully.
Pernyataan Penyangkalan
Informasi dan publikasi ini tidak dimaksudkan, dan bukan merupakan, saran atau rekomendasi keuangan, investasi, trading, atau jenis lainnya yang diberikan atau didukung oleh TradingView. Baca selengkapnya di Ketentuan Penggunaan.
Pernyataan Penyangkalan
Informasi dan publikasi ini tidak dimaksudkan, dan bukan merupakan, saran atau rekomendasi keuangan, investasi, trading, atau jenis lainnya yang diberikan atau didukung oleh TradingView. Baca selengkapnya di Ketentuan Penggunaan.