📊 **To view my confluences and linework:**
Step 1️⃣: Grab the chart
Step 2️⃣: Unhide Group 1 in the object tree
Step 3️⃣: Hide and unhide specific confluences one by one
💡 **Pro tip:** Double-click the screen to reveal RSI, MFI, CVD, and OBV indicators alongside divergence markings! 🎯
⚔️ Bears Flushed at Channel Support - Bulls Reload 🔄
The Market Participant Battle:
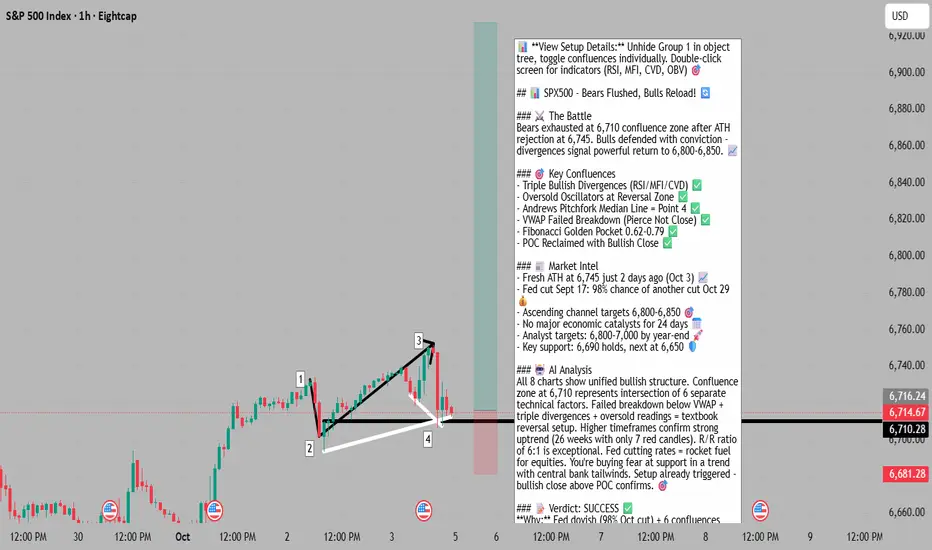
Bears just lost a critical skirmish. After pushing SPX down from fresh all-time highs at 6,745 on October 3rd, the selling pressure exhausted precisely at the intersection of multiple support confluences around 6,710. The setup is textbook: bears overextended their hand at a major resistance cluster (Andrews Pitchfork median line, VWAP standard deviation, golden Fibonacci zone), creating bullish divergences across RSI, MFI, and CVD. Bulls defended the 6,710 level with conviction, and now the spring is coiled for a powerful return back toward 6,800-6,850. This is classic institutional accumulation at support - let retail sell into strong hands, then reverse hard. 📈
Confluences:
Confluence 1: Triple Bullish Divergences (RSI, MFI, CVD) 📊
The 1-hour chart reveals the smoking gun: while price made lower lows from point 3 to point 4, RSI, MFI, and CVD all made higher lows. This is textbook bullish divergence indicating weakening bearish momentum despite falling price. The divergences are marked clearly on your indicators - RSI showed "Bear" tags at points 1, 2, and 3, but failed to confirm at point 4. MFI followed the same pattern. Most importantly, CVD (Cumulative Volume Delta) shows buyers stepping in despite price weakness, revealing hidden institutional accumulation. These divergences on the 1H timeframe carry significant weight, especially when confirmed across multiple momentum indicators simultaneously.
Confluence 2: Oversold RSI and MFI Conditions ⚡
Both RSI and MFI hit oversold territory at point 4, creating a classic mean-reversion setup. While the higher timeframes show SPX in overbought territory (which is normal in strong uptrends), the pullback created oversold readings on the 1H and 2H charts. This creates an asymmetric opportunity - buying at oversold levels within a confirmed uptrend. The RSI bounced from near 30, and MFI showed similar exhaustion. This oversold condition combined with the divergences suggests the selling pressure has been fully absorbed.
Confluence 3: Andrews Pitchfork - Median Line Precision 🎯
The Andrews Pitchfork anchored at points 1, 2, and 3 shows remarkable precision - point 4 landed exactly on the median line of the pitchfork. This is a high-probability reversal zone in pitchfork theory. The price action shows respect for this geometry, with the median line acting as dynamic support. The pitchfork structure suggests the next move should target the upper parallel channel line, which aligns with the 6,800-6,850 zone identified in broader market analysis. This technical pattern has been reliable throughout this uptrend sequence.
Confluence 4: Anchored VWAP - Failed Breakdown 💪
The VWAP anchored at point 1 (the swing low) provides critical context. Price pierced below the 1st standard deviation line but critically failed to close below it. This is a failed breakdown - a bullish signal that suggests sellers couldn't establish conviction below this institutional reference point. The wick below VWAP represents stop-hunting and capitulation selling, but the close back above the 1st standard deviation shows bulls defended this level aggressively. This failed breakdown pattern often precedes sharp reversals as shorts get trapped.
Confluence 5: Fibonacci Golden Zone (0.62-0.79 Retracement) 📐
The pullback from point 3 to point 4 retraced perfectly into the 0.62-0.79 Fibonacci zone - the "golden pocket" where probability favors reversals. This is the sweet spot for trend continuation entries. The fib extension from the 2→3 move shows point 4 landed right in this high-probability reversal zone. Combined with the other confluences, this creates a layered support structure that makes the 6,710 area a fortress for bulls.
Confluence 6: Developing POC and Volume Profile 📊
Your 2H chart shows a developing Point of Control (POC) at the recent low, with a bullish candle closing above it. This is significant - it shows that after the dip below the developing POC, buyers stepped in with conviction to reclaim it. The volume profile analysis suggests this area represents strong two-way trade, but the bullish close above the POC indicates buyers won this battle. This shift from below to above the POC is often an early signal of trend resumption.
Web Research Findings:
- **Technical Analysis:** SPX hit fresh all-time highs of 6,745-6,750 on October 3, 2025, just 2 days ago. The index is trading in a well-defined ascending channel that began on May 23, 2025. Current key support levels are 6,690 (short-term) and 6,120 (medium-term). Upside targets within the channel are 6,800-6,850, which represents the upper boundary of the ascending channel. Multiple technical analysts note that while RSI on higher timeframes is overbought (above 70), this can persist in strong uptrends. Investtech notes "no resistance in the price chart and further rise is indicated."
- **Recent News/Earnings:** The S&P 500 just posted its 52nd record high of 2025, closing above 6,700 for the first time. The market has shown exceptional strength with only 7 red weekly candles out of the last 26 weeks. Major tech companies continue to report strong earnings, with Nvidia announcing a massive $100 billion investment in OpenAI data centers. The market has largely shrugged off concerns about a potential US government shutdown, focusing instead on dovish Fed policy. Market breadth shows the only Mag-7 stocks above 2024 highs are Nvidia and Microsoft, suggesting some rotation but not broad weakness.
- **Analyst Sentiment:** Mixed but leaning bullish. Several analysts target 6,800-6,850 in the near term. Deutsche Bank's Chief Global Strategist calls for SPX to hit 7,000 by year-end. Some analysts warn of potential correction due to overbought conditions and breadth divergences, but most view any pullbacks as buyable. OANDA's Kelvin Wong states: "The US SPX 500 has continued to evolve within a medium-term ascending channel...The hourly RSI momentum indicator remains in a bullish momentum condition." However, some caution about euphoric sentiment and potential for healthy correction to 6,500 area if current levels fail.
- **Data Releases & Economic Calendar:** No major economic releases in the next 24-48 hours that could derail the setup. The critical September jobs report has already passed. The next significant event is the FOMC meeting on October 29, 2025 (24 days away). The US government shutdown may delay some economic data releases, but markets have shown resilience to this uncertainty.
- **Interest Rate Impact:** This is a MAJOR bullish catalyst. The Fed cut rates by 25 basis points on September 17, 2025, moving from 4.50% to 4.00%-4.25% range. CME FedWatch Tool shows 98% probability of another 25bp cut at the October 29 FOMC meeting, and 87% probability of a third cut in December. This would bring rates to 3.50%-3.75% by year-end. Fed Governor Stephen Miran has been pushing for even more aggressive cuts. The dovish Fed pivot is providing strong tailwinds for equities. Lower rates increase liquidity and typically fuel risk asset rallies. This is creating a "positive feedback loop" according to market analysts.
Layman's Summary:
Here's what all this means in simple terms: The S&P 500 just hit a new record high 2 days ago at 6,745, then pulled back to 6,710 - about a 0.5% dip. This is completely normal and healthy in an uptrend. The Federal Reserve (the people who control interest rates) just cut rates and is highly likely to cut again in 3 weeks. Lower interest rates are like rocket fuel for stocks because they make money cheaper and drive investors into equities. Your technical setup caught this pullback at the exact right spot - multiple indicators show the selling is exhausted and buyers are stepping back in. The big picture: we're in a strong uptrend with the central bank on our side, you're buying a small dip at strong support, and the path of least resistance is back up to 6,800-6,850. The risks? Market is a bit overbought on bigger timeframes, but in strong trends that can persist for a while. No major scary news on the horizon that would crash the market. This is a high-probability bounce setup in favorable market conditions. 🎯
Machine Derived Information:
- **Image 1 (1H Chart - Main Setup):** Shows the complete trade structure from points 1-4 with the Andrews Pitchfork and key horizontal support/resistance levels. The gray area is background, not a support box. Point 4 landed at the pitchfork median line around 6,710. **Significance:** This reveals the geometric precision of the reversal zone and the logical price structure. **AGREES ✔**
- **Image 2 (1H Chart - Annotations):** Details the specific confluences: 1→4 sequence, bullish divergences on RSI/MFI/CVD, oversold conditions, Andrews Pitchfork catching point 4 at median line, anchored VWAP pierce but no close below 1st std dev, and Fibonacci 0.62-0.79 pullback zone. **Significance:** This image provides the technical evidence backing the entire trade thesis - all confluences are clearly marked and valid. **AGREES ✔**
- **Image 3 (1H Chart - Bollinger Bands):** Shows the same setup with Bollinger Band overlay and cumulative delta analysis. Points 1-4 are marked with price action context. **Significance:** The Bollinger Band touch at point 4 adds another technical confluence, showing price reached the lower band (another oversold indicator) before reversing. **AGREES ✔**
- **Image 4 (1H Chart - Indicators Panel):** The most critical image - shows RSI with "Bear" tags at points 1, 2, and 3 (each at peaks), MFI weakness, and CVD analysis. The bullish divergences are visually obvious here as indicators make higher lows while price makes lower lows. **Significance:** This is the proof of momentum divergence - the engine driving the reversal setup. Shows clear exhaustion of selling pressure. **AGREES ✔**
- **Image 5 (1H Chart - Pitchfork Focus):** Zoomed view emphasizing the Andrews Pitchfork structure with downtrend lines. Shows how point 4 aligned perfectly with the median line. **Significance:** Reinforces the geometrical precision of the setup and the probability of mean reversion back toward the upper pitchfork boundary. **AGREES ✔**
- **Image 6 (2H Chart - Bigger Picture):** Steps back to the 2H timeframe showing the broader uptrend from 6,657 to the recent highs. Shows trend strength indicators: +28 bars uptrend on 50-bar basis, strong positive readings. The current level shows as TLPv27.1 with uptrend strength metrics. **Significance:** Confirms we're buying a pullback in a confirmed uptrend, not trying to catch a falling knife. The 2H timeframe validates the bullish structure. **AGREES ✔**
- **Image 7 (2H Chart - Trade Levels):** Shows detailed trade management with entry at 6,715, stop at 6,688 (34.96 points, 0.52%), and targets. Risk/Reward ratio of 6.04 is marked. Long TP and Short EN zones are marked showing institutional trade clusters. **Significance:** Demonstrates proper risk management with tight stop below key support and excellent R/R ratio. The 0.52% stop is appropriate for this setup. **AGREES ✔**
- **Image 8 (3H Chart - Pattern Context):** Shows an Ascending Triangle pattern on the 3H timeframe with targets at 6,799.19 (T1) and 6,967.1 (T2). Entry marked at 6,715.23, stop at 6,631.28. Pattern is 18 periods old and still valid. **Significance:** Adds a bullish continuation pattern context on higher timeframe. The ascending triangle supports the bullish thesis and provides additional upside targets that align with channel resistance. **AGREES ✔**
Actionable Machine Summary:
All eight chart images present a unified, coherent bullish case with zero contradictions. The setup quality is exceptional: 1) You have a confluence zone (6,710) where five distinct technical factors converge - pitchfork median, VWAP standard deviation, Fibonacci golden zone, developing POC, and oversold indicators. 2) Momentum divergences on three separate indicators (RSI, MFI, CVD) confirm selling exhaustion at this exact level. 3) Higher timeframe structure (2H and 3H) confirms we're in a strong uptrend with an ascending triangle pattern projecting targets to 6,800-6,967. 4) Risk management is proper with a tight 0.52% stop (6,688) below all key support structures. 5) The R/R ratio of 6:1 is excellent, meaning you only need this trade to work 1 out of 6 times to be profitable long-term. For execution: Entry 6,715, Stop 6,688, Target 1: 6,799, Target 2: 6,850-6,967. The setup has already triggered (you're at point 4), and the bullish candle closing above the developing POC suggests the reversal is confirming. This is a textbook high-probability mean-reversion long in a trending market. 🎯
Conclusion:
**Trade Prediction:** SUCCESS ✅
**Confidence:** High
**Key Reasons for Success:**
1. **Fed Tailwinds Are Massive:** With 98% probability of rate cut on Oct 29 and 87% for December, monetary policy is your friend. Lower rates = higher stock prices. This macro backdrop creates a bullish bias that makes buying dips in uptrends a high-probability strategy.
2. **Multiple Technical Confluences Align Perfectly:** It's rare to get this many factors agreeing at one price level - pitchfork median, VWAP, Fibonacci golden zone, POC, oversold oscillators, and triple divergences all at 6,710. This creates a high-conviction zone.
3. **Uptrend Structure Intact:** The ascending channel from May 23 is well-defined with clear targets at 6,800-6,850. You're buying a pullback within this structure, not fighting the trend. The 2H and 3H charts confirm trend strength.
4. **Failed Breakdown Below VWAP:** Price pierced below 1st standard deviation VWAP but couldn't close there - this is a bear trap. Failed breakdowns often lead to explosive reversals as shorts cover and bulls regain control.
5. **Excellent Risk/Reward:** With a stop at 6,688 and targets at 6,799-6,850, you're risking ~0.52% to make 1.2%-2.0%. That's a 2.3:1 to 3.8:1 R/R ratio on the conservative side, and your chart shows 6:1 if the full move plays out.
**Key Risks to Monitor:**
1. **Overbought on Higher Timeframes:** While the pullback created oversold conditions on 1H-3H, the daily and weekly charts show RSI >70. This means the market could enter a consolidation or deeper correction. If 6,688 breaks, next support is 6,650-6,660.
2. **Breadth Divergences Noted by Analysts:** Some market analysts point out that only Nvidia and Microsoft are above 2024 highs among Mag-7 stocks. This suggests the rally may be narrowing, which can precede corrections.
3. **Euphoric Sentiment:** Several analysts warn that sentiment has shifted from fear to euphoria. When everyone is bullish, it can create crowded positioning that reverses sharply. However, this is more of a medium-term risk than a short-term factor.
4. **Stop Below 6,690 Critical:** Your key support at 6,690 is the line in the sand. A clean break below on volume would invalidate the setup and could lead to 6,650 or even 6,600. Respect your stop.
5. **October Seasonality:** While the Rosh Hashanah to Yom Kippur weakness period just passed (Sept 22-Oct 2), October can still be volatile. However, historical data shows October-January are typically strong months for equities.
**Risk/Reward Assessment:**
The R/R strongly justifies this trade. Risking 0.52% (to 6,688) to make 1.2%-2.0% (to 6,800-6,850) is textbook asymmetry. Even if this setup only has a 50% win rate, the R/R makes it profitable over time. But given the confluence of factors, I'd estimate 65-70% probability of reaching at least 6,799 in the next 5-10 trading days.
**Final Recommendation:** TAKE THE TRADE 🚀
**Execution Plan:**
- **Entry:** 6,715 (you're already in based on chart 7) ✅
- **Stop Loss:** 6,688 (below all key support structures)
- **Target 1:** 6,799 (T1 from ascending triangle) - Take 50% profit here
- **Target 2:** 6,850 (upper channel boundary) - Let the rest ride with trailing stop
- **Time Horizon:** 5-10 trading days expected for T1, potentially 2-3 weeks for T2
**Risk Management:**
With a 0.52% stop, this is a well-sized trade. If using 1% account risk per trade, this translates to approximately 2x normal position size given the tight stop. The excellent R/R ratio supports slightly larger position sizing, but never exceed 2% account risk on any single trade.
The setup is firing on all cylinders: technical, fundamental (Fed policy), and sentiment (buying fear in an uptrend). The market just gave you a gift by pulling back to this confluence zone. Don't overthink it - execute the plan, respect the stop, and let probability work in your favor. Bulls have all the ammo they need to push this back to 6,800+. 🎯💪
Good luck and trade safe! 🚀
Step 1️⃣: Grab the chart
Step 2️⃣: Unhide Group 1 in the object tree
Step 3️⃣: Hide and unhide specific confluences one by one
💡 **Pro tip:** Double-click the screen to reveal RSI, MFI, CVD, and OBV indicators alongside divergence markings! 🎯
⚔️ Bears Flushed at Channel Support - Bulls Reload 🔄
The Market Participant Battle:
Bears just lost a critical skirmish. After pushing SPX down from fresh all-time highs at 6,745 on October 3rd, the selling pressure exhausted precisely at the intersection of multiple support confluences around 6,710. The setup is textbook: bears overextended their hand at a major resistance cluster (Andrews Pitchfork median line, VWAP standard deviation, golden Fibonacci zone), creating bullish divergences across RSI, MFI, and CVD. Bulls defended the 6,710 level with conviction, and now the spring is coiled for a powerful return back toward 6,800-6,850. This is classic institutional accumulation at support - let retail sell into strong hands, then reverse hard. 📈
Confluences:
Confluence 1: Triple Bullish Divergences (RSI, MFI, CVD) 📊
The 1-hour chart reveals the smoking gun: while price made lower lows from point 3 to point 4, RSI, MFI, and CVD all made higher lows. This is textbook bullish divergence indicating weakening bearish momentum despite falling price. The divergences are marked clearly on your indicators - RSI showed "Bear" tags at points 1, 2, and 3, but failed to confirm at point 4. MFI followed the same pattern. Most importantly, CVD (Cumulative Volume Delta) shows buyers stepping in despite price weakness, revealing hidden institutional accumulation. These divergences on the 1H timeframe carry significant weight, especially when confirmed across multiple momentum indicators simultaneously.
Confluence 2: Oversold RSI and MFI Conditions ⚡
Both RSI and MFI hit oversold territory at point 4, creating a classic mean-reversion setup. While the higher timeframes show SPX in overbought territory (which is normal in strong uptrends), the pullback created oversold readings on the 1H and 2H charts. This creates an asymmetric opportunity - buying at oversold levels within a confirmed uptrend. The RSI bounced from near 30, and MFI showed similar exhaustion. This oversold condition combined with the divergences suggests the selling pressure has been fully absorbed.
Confluence 3: Andrews Pitchfork - Median Line Precision 🎯
The Andrews Pitchfork anchored at points 1, 2, and 3 shows remarkable precision - point 4 landed exactly on the median line of the pitchfork. This is a high-probability reversal zone in pitchfork theory. The price action shows respect for this geometry, with the median line acting as dynamic support. The pitchfork structure suggests the next move should target the upper parallel channel line, which aligns with the 6,800-6,850 zone identified in broader market analysis. This technical pattern has been reliable throughout this uptrend sequence.
Confluence 4: Anchored VWAP - Failed Breakdown 💪
The VWAP anchored at point 1 (the swing low) provides critical context. Price pierced below the 1st standard deviation line but critically failed to close below it. This is a failed breakdown - a bullish signal that suggests sellers couldn't establish conviction below this institutional reference point. The wick below VWAP represents stop-hunting and capitulation selling, but the close back above the 1st standard deviation shows bulls defended this level aggressively. This failed breakdown pattern often precedes sharp reversals as shorts get trapped.
Confluence 5: Fibonacci Golden Zone (0.62-0.79 Retracement) 📐
The pullback from point 3 to point 4 retraced perfectly into the 0.62-0.79 Fibonacci zone - the "golden pocket" where probability favors reversals. This is the sweet spot for trend continuation entries. The fib extension from the 2→3 move shows point 4 landed right in this high-probability reversal zone. Combined with the other confluences, this creates a layered support structure that makes the 6,710 area a fortress for bulls.
Confluence 6: Developing POC and Volume Profile 📊
Your 2H chart shows a developing Point of Control (POC) at the recent low, with a bullish candle closing above it. This is significant - it shows that after the dip below the developing POC, buyers stepped in with conviction to reclaim it. The volume profile analysis suggests this area represents strong two-way trade, but the bullish close above the POC indicates buyers won this battle. This shift from below to above the POC is often an early signal of trend resumption.
Web Research Findings:
- **Technical Analysis:** SPX hit fresh all-time highs of 6,745-6,750 on October 3, 2025, just 2 days ago. The index is trading in a well-defined ascending channel that began on May 23, 2025. Current key support levels are 6,690 (short-term) and 6,120 (medium-term). Upside targets within the channel are 6,800-6,850, which represents the upper boundary of the ascending channel. Multiple technical analysts note that while RSI on higher timeframes is overbought (above 70), this can persist in strong uptrends. Investtech notes "no resistance in the price chart and further rise is indicated."
- **Recent News/Earnings:** The S&P 500 just posted its 52nd record high of 2025, closing above 6,700 for the first time. The market has shown exceptional strength with only 7 red weekly candles out of the last 26 weeks. Major tech companies continue to report strong earnings, with Nvidia announcing a massive $100 billion investment in OpenAI data centers. The market has largely shrugged off concerns about a potential US government shutdown, focusing instead on dovish Fed policy. Market breadth shows the only Mag-7 stocks above 2024 highs are Nvidia and Microsoft, suggesting some rotation but not broad weakness.
- **Analyst Sentiment:** Mixed but leaning bullish. Several analysts target 6,800-6,850 in the near term. Deutsche Bank's Chief Global Strategist calls for SPX to hit 7,000 by year-end. Some analysts warn of potential correction due to overbought conditions and breadth divergences, but most view any pullbacks as buyable. OANDA's Kelvin Wong states: "The US SPX 500 has continued to evolve within a medium-term ascending channel...The hourly RSI momentum indicator remains in a bullish momentum condition." However, some caution about euphoric sentiment and potential for healthy correction to 6,500 area if current levels fail.
- **Data Releases & Economic Calendar:** No major economic releases in the next 24-48 hours that could derail the setup. The critical September jobs report has already passed. The next significant event is the FOMC meeting on October 29, 2025 (24 days away). The US government shutdown may delay some economic data releases, but markets have shown resilience to this uncertainty.
- **Interest Rate Impact:** This is a MAJOR bullish catalyst. The Fed cut rates by 25 basis points on September 17, 2025, moving from 4.50% to 4.00%-4.25% range. CME FedWatch Tool shows 98% probability of another 25bp cut at the October 29 FOMC meeting, and 87% probability of a third cut in December. This would bring rates to 3.50%-3.75% by year-end. Fed Governor Stephen Miran has been pushing for even more aggressive cuts. The dovish Fed pivot is providing strong tailwinds for equities. Lower rates increase liquidity and typically fuel risk asset rallies. This is creating a "positive feedback loop" according to market analysts.
Layman's Summary:
Here's what all this means in simple terms: The S&P 500 just hit a new record high 2 days ago at 6,745, then pulled back to 6,710 - about a 0.5% dip. This is completely normal and healthy in an uptrend. The Federal Reserve (the people who control interest rates) just cut rates and is highly likely to cut again in 3 weeks. Lower interest rates are like rocket fuel for stocks because they make money cheaper and drive investors into equities. Your technical setup caught this pullback at the exact right spot - multiple indicators show the selling is exhausted and buyers are stepping back in. The big picture: we're in a strong uptrend with the central bank on our side, you're buying a small dip at strong support, and the path of least resistance is back up to 6,800-6,850. The risks? Market is a bit overbought on bigger timeframes, but in strong trends that can persist for a while. No major scary news on the horizon that would crash the market. This is a high-probability bounce setup in favorable market conditions. 🎯
Machine Derived Information:
- **Image 1 (1H Chart - Main Setup):** Shows the complete trade structure from points 1-4 with the Andrews Pitchfork and key horizontal support/resistance levels. The gray area is background, not a support box. Point 4 landed at the pitchfork median line around 6,710. **Significance:** This reveals the geometric precision of the reversal zone and the logical price structure. **AGREES ✔**
- **Image 2 (1H Chart - Annotations):** Details the specific confluences: 1→4 sequence, bullish divergences on RSI/MFI/CVD, oversold conditions, Andrews Pitchfork catching point 4 at median line, anchored VWAP pierce but no close below 1st std dev, and Fibonacci 0.62-0.79 pullback zone. **Significance:** This image provides the technical evidence backing the entire trade thesis - all confluences are clearly marked and valid. **AGREES ✔**
- **Image 3 (1H Chart - Bollinger Bands):** Shows the same setup with Bollinger Band overlay and cumulative delta analysis. Points 1-4 are marked with price action context. **Significance:** The Bollinger Band touch at point 4 adds another technical confluence, showing price reached the lower band (another oversold indicator) before reversing. **AGREES ✔**
- **Image 4 (1H Chart - Indicators Panel):** The most critical image - shows RSI with "Bear" tags at points 1, 2, and 3 (each at peaks), MFI weakness, and CVD analysis. The bullish divergences are visually obvious here as indicators make higher lows while price makes lower lows. **Significance:** This is the proof of momentum divergence - the engine driving the reversal setup. Shows clear exhaustion of selling pressure. **AGREES ✔**
- **Image 5 (1H Chart - Pitchfork Focus):** Zoomed view emphasizing the Andrews Pitchfork structure with downtrend lines. Shows how point 4 aligned perfectly with the median line. **Significance:** Reinforces the geometrical precision of the setup and the probability of mean reversion back toward the upper pitchfork boundary. **AGREES ✔**
- **Image 6 (2H Chart - Bigger Picture):** Steps back to the 2H timeframe showing the broader uptrend from 6,657 to the recent highs. Shows trend strength indicators: +28 bars uptrend on 50-bar basis, strong positive readings. The current level shows as TLPv27.1 with uptrend strength metrics. **Significance:** Confirms we're buying a pullback in a confirmed uptrend, not trying to catch a falling knife. The 2H timeframe validates the bullish structure. **AGREES ✔**
- **Image 7 (2H Chart - Trade Levels):** Shows detailed trade management with entry at 6,715, stop at 6,688 (34.96 points, 0.52%), and targets. Risk/Reward ratio of 6.04 is marked. Long TP and Short EN zones are marked showing institutional trade clusters. **Significance:** Demonstrates proper risk management with tight stop below key support and excellent R/R ratio. The 0.52% stop is appropriate for this setup. **AGREES ✔**
- **Image 8 (3H Chart - Pattern Context):** Shows an Ascending Triangle pattern on the 3H timeframe with targets at 6,799.19 (T1) and 6,967.1 (T2). Entry marked at 6,715.23, stop at 6,631.28. Pattern is 18 periods old and still valid. **Significance:** Adds a bullish continuation pattern context on higher timeframe. The ascending triangle supports the bullish thesis and provides additional upside targets that align with channel resistance. **AGREES ✔**
Actionable Machine Summary:
All eight chart images present a unified, coherent bullish case with zero contradictions. The setup quality is exceptional: 1) You have a confluence zone (6,710) where five distinct technical factors converge - pitchfork median, VWAP standard deviation, Fibonacci golden zone, developing POC, and oversold indicators. 2) Momentum divergences on three separate indicators (RSI, MFI, CVD) confirm selling exhaustion at this exact level. 3) Higher timeframe structure (2H and 3H) confirms we're in a strong uptrend with an ascending triangle pattern projecting targets to 6,800-6,967. 4) Risk management is proper with a tight 0.52% stop (6,688) below all key support structures. 5) The R/R ratio of 6:1 is excellent, meaning you only need this trade to work 1 out of 6 times to be profitable long-term. For execution: Entry 6,715, Stop 6,688, Target 1: 6,799, Target 2: 6,850-6,967. The setup has already triggered (you're at point 4), and the bullish candle closing above the developing POC suggests the reversal is confirming. This is a textbook high-probability mean-reversion long in a trending market. 🎯
Conclusion:
**Trade Prediction:** SUCCESS ✅
**Confidence:** High
**Key Reasons for Success:**
1. **Fed Tailwinds Are Massive:** With 98% probability of rate cut on Oct 29 and 87% for December, monetary policy is your friend. Lower rates = higher stock prices. This macro backdrop creates a bullish bias that makes buying dips in uptrends a high-probability strategy.
2. **Multiple Technical Confluences Align Perfectly:** It's rare to get this many factors agreeing at one price level - pitchfork median, VWAP, Fibonacci golden zone, POC, oversold oscillators, and triple divergences all at 6,710. This creates a high-conviction zone.
3. **Uptrend Structure Intact:** The ascending channel from May 23 is well-defined with clear targets at 6,800-6,850. You're buying a pullback within this structure, not fighting the trend. The 2H and 3H charts confirm trend strength.
4. **Failed Breakdown Below VWAP:** Price pierced below 1st standard deviation VWAP but couldn't close there - this is a bear trap. Failed breakdowns often lead to explosive reversals as shorts cover and bulls regain control.
5. **Excellent Risk/Reward:** With a stop at 6,688 and targets at 6,799-6,850, you're risking ~0.52% to make 1.2%-2.0%. That's a 2.3:1 to 3.8:1 R/R ratio on the conservative side, and your chart shows 6:1 if the full move plays out.
**Key Risks to Monitor:**
1. **Overbought on Higher Timeframes:** While the pullback created oversold conditions on 1H-3H, the daily and weekly charts show RSI >70. This means the market could enter a consolidation or deeper correction. If 6,688 breaks, next support is 6,650-6,660.
2. **Breadth Divergences Noted by Analysts:** Some market analysts point out that only Nvidia and Microsoft are above 2024 highs among Mag-7 stocks. This suggests the rally may be narrowing, which can precede corrections.
3. **Euphoric Sentiment:** Several analysts warn that sentiment has shifted from fear to euphoria. When everyone is bullish, it can create crowded positioning that reverses sharply. However, this is more of a medium-term risk than a short-term factor.
4. **Stop Below 6,690 Critical:** Your key support at 6,690 is the line in the sand. A clean break below on volume would invalidate the setup and could lead to 6,650 or even 6,600. Respect your stop.
5. **October Seasonality:** While the Rosh Hashanah to Yom Kippur weakness period just passed (Sept 22-Oct 2), October can still be volatile. However, historical data shows October-January are typically strong months for equities.
**Risk/Reward Assessment:**
The R/R strongly justifies this trade. Risking 0.52% (to 6,688) to make 1.2%-2.0% (to 6,800-6,850) is textbook asymmetry. Even if this setup only has a 50% win rate, the R/R makes it profitable over time. But given the confluence of factors, I'd estimate 65-70% probability of reaching at least 6,799 in the next 5-10 trading days.
**Final Recommendation:** TAKE THE TRADE 🚀
**Execution Plan:**
- **Entry:** 6,715 (you're already in based on chart 7) ✅
- **Stop Loss:** 6,688 (below all key support structures)
- **Target 1:** 6,799 (T1 from ascending triangle) - Take 50% profit here
- **Target 2:** 6,850 (upper channel boundary) - Let the rest ride with trailing stop
- **Time Horizon:** 5-10 trading days expected for T1, potentially 2-3 weeks for T2
**Risk Management:**
With a 0.52% stop, this is a well-sized trade. If using 1% account risk per trade, this translates to approximately 2x normal position size given the tight stop. The excellent R/R ratio supports slightly larger position sizing, but never exceed 2% account risk on any single trade.
The setup is firing on all cylinders: technical, fundamental (Fed policy), and sentiment (buying fear in an uptrend). The market just gave you a gift by pulling back to this confluence zone. Don't overthink it - execute the plan, respect the stop, and let probability work in your favor. Bulls have all the ammo they need to push this back to 6,800+. 🎯💪
Good luck and trade safe! 🚀
all my paid ( pro ) scripts can be obtained for a low price of 19.99 / month at : whop.com/sabr-pro-tools/access-to-all-pro-tools/
Pernyataan Penyangkalan
The information and publications are not meant to be, and do not constitute, financial, investment, trading, or other types of advice or recommendations supplied or endorsed by TradingView. Read more in the Terms of Use.