SOL/USDT Weekly Chart Update
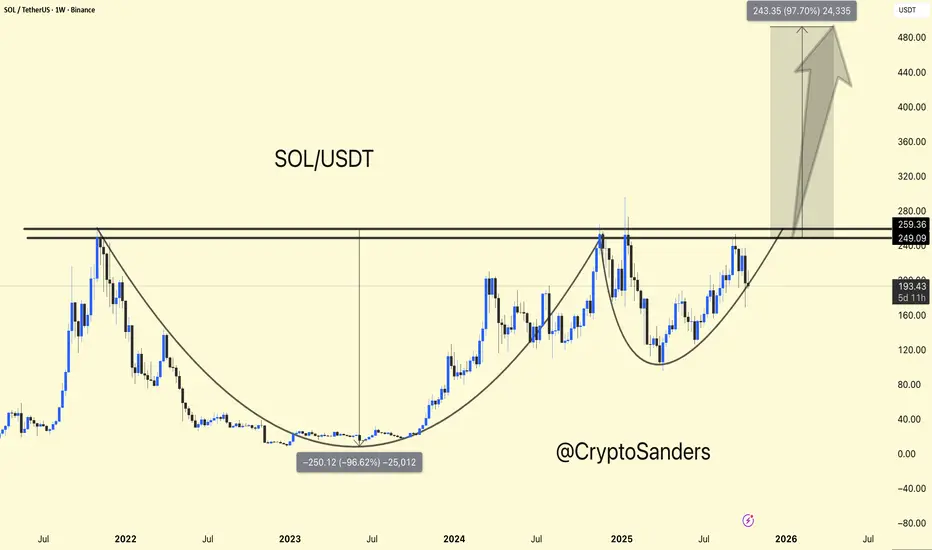
SOL is forming a massive cup and handle pattern on the weekly timeframe – a strong bullish continuation setup leading to a major breakout.
Currently trading around $199, SOL is consolidating below the key resistance level of $250-$260. Once we achieve a weekly close above $260, it could confirm a breakout move towards $450-$480 (approximately +90-100% upside).
Support: $170-$180 (handle base/accumulation zone)
Resistance: $250-$260 (breakout zone)
Target: $450-$480
Overall sentiment remains bullish – the structure is clear, and momentum is building. A confirmed breakout above the resistance level could mark the start of SOL's next major surge.
DYOR | NFA
Publikasi terkait
Pernyataan Penyangkalan
Informasi dan publikasi ini tidak dimaksudkan, dan bukan merupakan, saran atau rekomendasi keuangan, investasi, trading, atau jenis lainnya yang diberikan atau didukung oleh TradingView. Baca selengkapnya di Ketentuan Penggunaan.
Publikasi terkait
Pernyataan Penyangkalan
Informasi dan publikasi ini tidak dimaksudkan, dan bukan merupakan, saran atau rekomendasi keuangan, investasi, trading, atau jenis lainnya yang diberikan atau didukung oleh TradingView. Baca selengkapnya di Ketentuan Penggunaan.