📊 SOL/USDT 4H – Bullish Reversal Setup 🚀
🔍 Market Structure Analysis
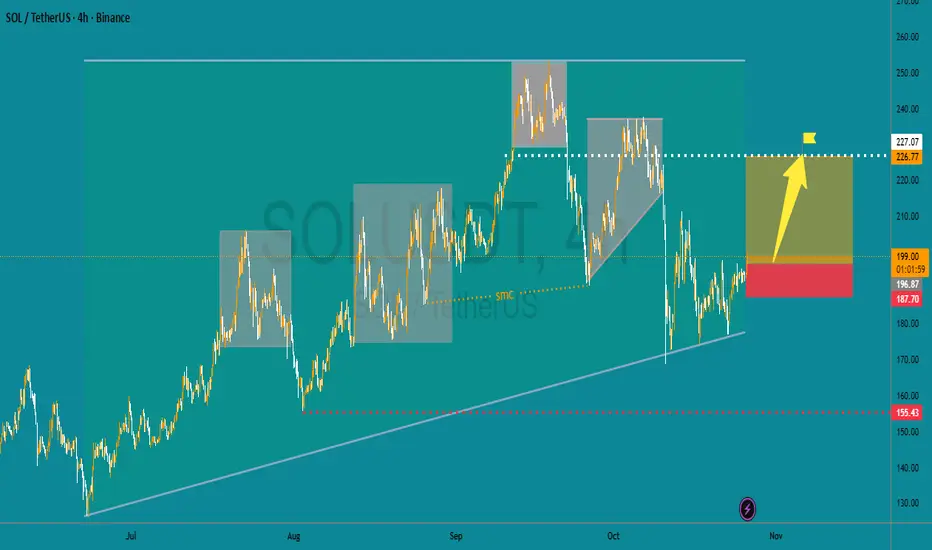
The market has shown a clear uptrend structure with higher lows (HLs) consistently forming along an ascending trendline 📈.
After a recent retracement, price respected the trendline support, signaling potential bullish continuation 🔁.
⚙️ Key Levels
Support Zone (Demand Area): 🟢 $185 – $190 → Buyers defending this region strongly.
Resistance Zone (Target Area): 🟡 $225 – $230 → Previous supply zone and structure high.
Invalidation (Stop-Loss Zone): 🔴 Below $185 → Break of structure if price drops here.
🧭 Trade Setup (as highlighted)
Entry Idea: Around $195 – $200 (current price range).
Stop-Loss: 🔻 Below $187 support.
Take Profit: 🎯 $227 zone (previous high).
Risk-to-Reward: Approximately 1:2.5, favorable for swing traders ⚖️.
💡 Market Psychology
The chart shows liquidity sweep of previous lows (liquidity grab 💧), followed by strong bullish momentum, indicating smart money accumulation (SMC concept).
The yellow arrow shows a potential break of structure (BOS) toward upside continuation.
📈 Summary
✅ Bullish momentum respected structure.
⚠️ Watch for confirmation candle close above $205–$210 before entering.
🔥 If confirmed, next bullish impulse could target $227+.
🏁 Conclusion: “Buy the Reversal, Ride the Trend” 🚀
Bias: Bullish 🟢
Strategy: Trend continuation after correction
Confidence: High if price holds above $190
🔍 Market Structure Analysis
The market has shown a clear uptrend structure with higher lows (HLs) consistently forming along an ascending trendline 📈.
After a recent retracement, price respected the trendline support, signaling potential bullish continuation 🔁.
⚙️ Key Levels
Support Zone (Demand Area): 🟢 $185 – $190 → Buyers defending this region strongly.
Resistance Zone (Target Area): 🟡 $225 – $230 → Previous supply zone and structure high.
Invalidation (Stop-Loss Zone): 🔴 Below $185 → Break of structure if price drops here.
🧭 Trade Setup (as highlighted)
Entry Idea: Around $195 – $200 (current price range).
Stop-Loss: 🔻 Below $187 support.
Take Profit: 🎯 $227 zone (previous high).
Risk-to-Reward: Approximately 1:2.5, favorable for swing traders ⚖️.
💡 Market Psychology
The chart shows liquidity sweep of previous lows (liquidity grab 💧), followed by strong bullish momentum, indicating smart money accumulation (SMC concept).
The yellow arrow shows a potential break of structure (BOS) toward upside continuation.
📈 Summary
✅ Bullish momentum respected structure.
⚠️ Watch for confirmation candle close above $205–$210 before entering.
🔥 If confirmed, next bullish impulse could target $227+.
🏁 Conclusion: “Buy the Reversal, Ride the Trend” 🚀
Bias: Bullish 🟢
Strategy: Trend continuation after correction
Confidence: High if price holds above $190
Join My Telegram Channel Link 👇
t.me/honeyspottrading
Join My Refferel Broker Link 👇
one.exnessonelink.com/a/uvd1etcgg1
Refferel code 👇
uvd1etcgg1
t.me/honeyspottrading
Join My Refferel Broker Link 👇
one.exnessonelink.com/a/uvd1etcgg1
Refferel code 👇
uvd1etcgg1
Publikasi terkait
Pernyataan Penyangkalan
Informasi dan publikasi tidak dimaksudkan untuk menjadi, dan bukan merupakan saran keuangan, investasi, perdagangan, atau rekomendasi lainnya yang diberikan atau didukung oleh TradingView. Baca selengkapnya di Persyaratan Penggunaan.