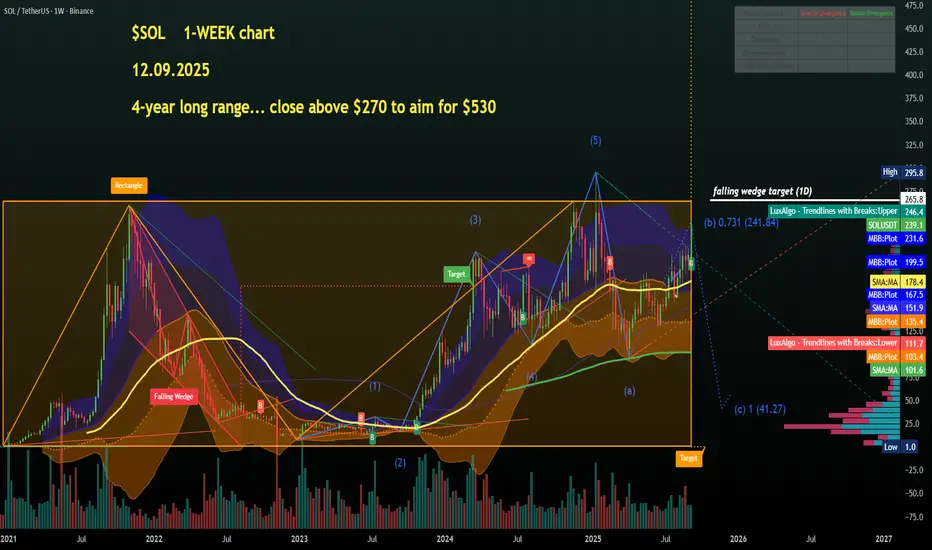
So, first of all a huge range since the beginning of 2021, let's call that a rectangle pattern giving us a clear long-term breakout level on weekly candle close above $265-$275, the higher the better.
RSI upcurved nicely at 66 so plenty of room to grow in Q4.
From there we would have a target of around $525, not unrealistic. Daily view next💙👽☝️
Pernyataan Penyangkalan
Informasi dan publikasi tidak dimaksudkan untuk menjadi, dan bukan merupakan saran keuangan, investasi, perdagangan, atau rekomendasi lainnya yang diberikan atau didukung oleh TradingView. Baca selengkapnya di Persyaratan Penggunaan.
Pernyataan Penyangkalan
Informasi dan publikasi tidak dimaksudkan untuk menjadi, dan bukan merupakan saran keuangan, investasi, perdagangan, atau rekomendasi lainnya yang diberikan atau didukung oleh TradingView. Baca selengkapnya di Persyaratan Penggunaan.