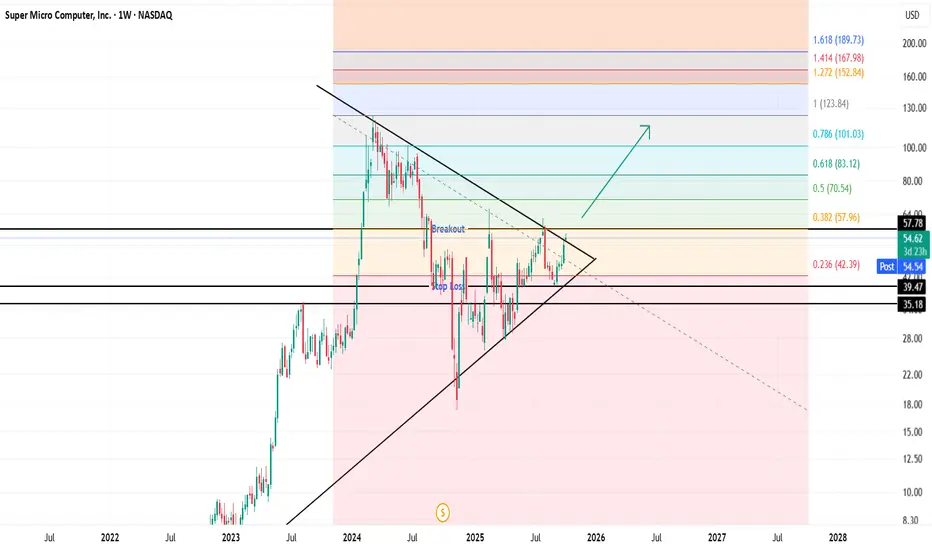
SMCI is at a major decision point. Wait for breakout confirmation above $57.78, use the triangle structure and Fibonacci extensions as your target zones, and manage risk via the marked stop levels. This technical setup combines classical charting with quantitative projections, providing a clear framework for swing traders and investors.
Key Levels and Setup
Symmetrical Triangle: Price is consolidating between converging trendlines, now nearing the apex, signaling an imminent breakout move.
Breakout Level: A sustained close above $57.78 (upper trendline/horizontal resistance) would confirm the bullish breakout.
Stop Loss: Clearly marked near the lower horizontal line (below $39.47 or $35.18) to protect against false breakouts.
Pernyataan Penyangkalan
Informasi dan publikasi tidak dimaksudkan untuk menjadi, dan bukan merupakan saran keuangan, investasi, perdagangan, atau rekomendasi lainnya yang diberikan atau didukung oleh TradingView. Baca selengkapnya di Persyaratan Penggunaan.
Pernyataan Penyangkalan
Informasi dan publikasi tidak dimaksudkan untuk menjadi, dan bukan merupakan saran keuangan, investasi, perdagangan, atau rekomendasi lainnya yang diberikan atau didukung oleh TradingView. Baca selengkapnya di Persyaratan Penggunaan.