Silver at Extremes: RSI Signals Haven’t Missed in 20 Years
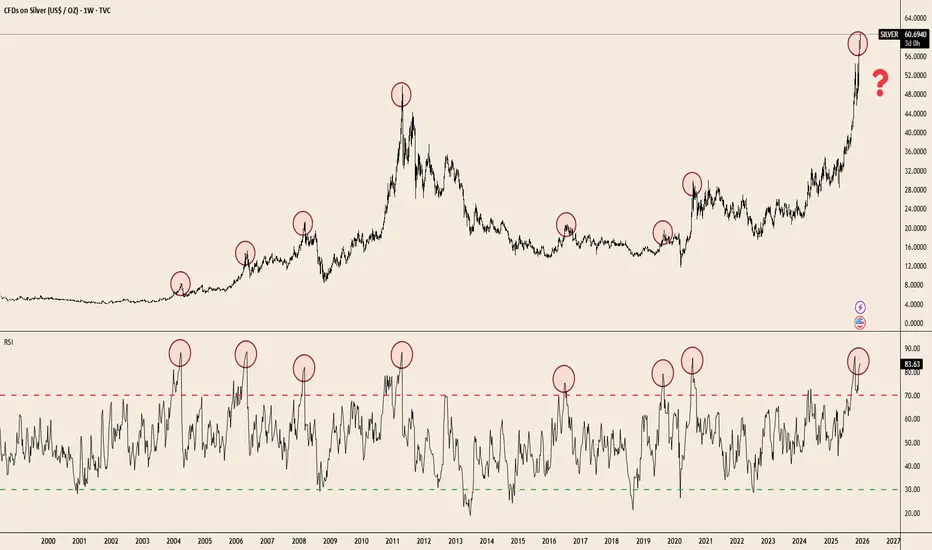
The chart makes the pattern clear:
• Each parabolic advance since 2004 ended with RSI extremes similar to today.
• Price is testing the same overextension zone seen at the 2011 blow-off top and the 2020 surge.
• Weekly RSI rarely stays above 80 for long — momentum tends to reset before the next leg can form.
This doesn’t guarantee a top.
But when a commodity doubles in a single year and hits long-term RSI ceilings simultaneously, risk/reward becomes asymmetric.
Silver’s trend remains powerful — the question now is how sustainable the slope is.
Pernyataan Penyangkalan
Informasi dan publikasi ini tidak dimaksudkan, dan bukan merupakan, saran atau rekomendasi keuangan, investasi, trading, atau jenis lainnya yang diberikan atau didukung oleh TradingView. Baca selengkapnya di Ketentuan Penggunaan.
Pernyataan Penyangkalan
Informasi dan publikasi ini tidak dimaksudkan, dan bukan merupakan, saran atau rekomendasi keuangan, investasi, trading, atau jenis lainnya yang diberikan atau didukung oleh TradingView. Baca selengkapnya di Ketentuan Penggunaan.