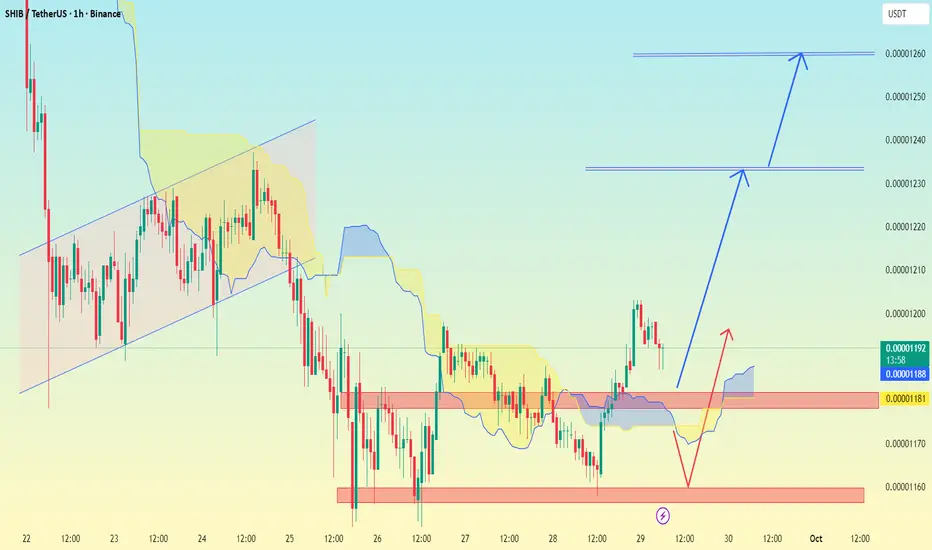
SHIB/USDT 1H chart, I see already marked possible targets with blue arrows. Based on the chart structure:
Immediate support zone: around 0.00001180 – 0.00001188 (red box).
Upside potential:
First target (short-term): 0.00001230
Second target (next level): 0.00001260
So the expected move is:
If SHIB holds above 0.00001180, bullish momentum can push it first to 0.00001230, and if that breaks, then toward 0.00001260.
If it breaks below 0.00001180, price could retest the lower support zone near 0.00001160.
📌 Summary:
Bullish target 1 → 0.00001230
Bullish target 2 → 0.00001260
Support to watch → 0.00001180 / 0.00001160
Trade aktif
trade activet.me/RSI_Trading_Point4
Forex, gold and crypto signal's with detailed analysis & get consistent results..
t.me/forexofdollarsmagnet
Gold signal's with proper TP & SL for high profits opportunities..
Forex, gold and crypto signal's with detailed analysis & get consistent results..
t.me/forexofdollarsmagnet
Gold signal's with proper TP & SL for high profits opportunities..
Publikasi terkait
Pernyataan Penyangkalan
Informasi dan publikasi tidak dimaksudkan untuk menjadi, dan bukan merupakan saran keuangan, investasi, perdagangan, atau rekomendasi lainnya yang diberikan atau didukung oleh TradingView. Baca selengkapnya di Persyaratan Penggunaan.
t.me/RSI_Trading_Point4
Forex, gold and crypto signal's with detailed analysis & get consistent results..
t.me/forexofdollarsmagnet
Gold signal's with proper TP & SL for high profits opportunities..
Forex, gold and crypto signal's with detailed analysis & get consistent results..
t.me/forexofdollarsmagnet
Gold signal's with proper TP & SL for high profits opportunities..
Publikasi terkait
Pernyataan Penyangkalan
Informasi dan publikasi tidak dimaksudkan untuk menjadi, dan bukan merupakan saran keuangan, investasi, perdagangan, atau rekomendasi lainnya yang diberikan atau didukung oleh TradingView. Baca selengkapnya di Persyaratan Penggunaan.