Detailed Market Structure Breakdown
4-Hour Chart (Macro Trend)
Structure: The Sensex is firmly in a bullish recovery phase, trading within a clear ascending channel. The correction seen on Wednesday was quickly absorbed and bought up on Thursday, confirming the strength of the bullish institutional buying. The price is now right below the major supply zone.
Key Levels:
Major Supply (Resistance): 82,300 - 82,500. This area is the critical overhead supply zone and a strong Order Block (OB). A decisive breakout here is needed to target 83,000.
Major Demand (Support): 81,600 - 81,800. This area is the key immediate support, aligned with the lower trendline of the ascending channel and a prior FVG (Fair Value Gap).
Outlook: The short-term bias is strongly bullish. The market is poised to challenge the 82,300 - 82,500 resistance band.
1-Hour Chart (Intermediate View)
Structure: The 1H chart shows the market successfully defending the 81,600 support and resuming the upward trajectory. The strong closing candle confirms the short-term bullish momentum.
Key Levels:
Immediate Resistance: 82,200 (Recent swing high).
Immediate Support: 81,900 (Prior consolidation support, now a flip zone).
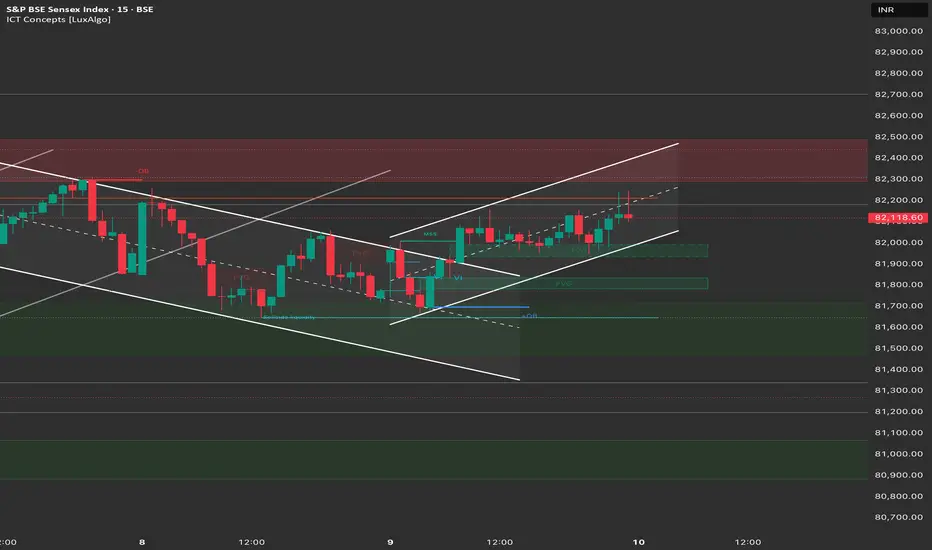
15-Minute Chart (Intraday View)
Structure: The 15M chart shows clear consolidation in a bullish flag/pennant pattern (ascending channel). The index closed at the upper end of the range, after briefly sweeping liquidity on the downside, which suggests a continuation is likely.
Key Levels:
Intraday Supply: 82,300.
Intraday Demand: 81,800 - 81,900.
Outlook: Strongly Bullish.
📈 Trade Plan (Friday, 10th October)
Market Outlook: The Sensex is showing strong underlying strength and is poised to challenge the major resistance. The primary strategy will be to buy on continuation.
Bullish Scenario (Primary Plan)
Justification: The market has confirmed a strong reversal, and the structure is now clearly bullish. Positive IT earnings (if reported) could provide the catalyst for a strong breakout.
Entry: Long entry on a decisive break and 15-minute candle close above 82,300.
Stop Loss (SL): Place a stop loss below 81,900 (below the immediate support).
Targets:
T1: 82,500 (Major supply zone).
T2: 82,800 (Extension target).
Bearish Scenario (Counter-Trend Plan)
Justification: Only valid if TCS results are negative or global cues cause a sharp rejection/gap down.
Trigger: A decisive break and 1-hour candle close below 81,600.
Entry: Short entry below 81,600.
Stop Loss (SL): Above 81,900.
Targets:
T1: 81,300 (Lower channel trendline).
T2: 81,000 (Psychological support).
Key Levels for Observation:
Immediate Decision Point: 82,000 - 82,300 zone.
Bullish Confirmation: A break and sustained move above 82,300.
Bearish Warning: A move below 81,800 suggests the bounce has failed.
Line in the Sand: 81,600. Below this level, the short-term bullish bias is nullified.
4-Hour Chart (Macro Trend)
Structure: The Sensex is firmly in a bullish recovery phase, trading within a clear ascending channel. The correction seen on Wednesday was quickly absorbed and bought up on Thursday, confirming the strength of the bullish institutional buying. The price is now right below the major supply zone.
Key Levels:
Major Supply (Resistance): 82,300 - 82,500. This area is the critical overhead supply zone and a strong Order Block (OB). A decisive breakout here is needed to target 83,000.
Major Demand (Support): 81,600 - 81,800. This area is the key immediate support, aligned with the lower trendline of the ascending channel and a prior FVG (Fair Value Gap).
Outlook: The short-term bias is strongly bullish. The market is poised to challenge the 82,300 - 82,500 resistance band.
1-Hour Chart (Intermediate View)
Structure: The 1H chart shows the market successfully defending the 81,600 support and resuming the upward trajectory. The strong closing candle confirms the short-term bullish momentum.
Key Levels:
Immediate Resistance: 82,200 (Recent swing high).
Immediate Support: 81,900 (Prior consolidation support, now a flip zone).
15-Minute Chart (Intraday View)
Structure: The 15M chart shows clear consolidation in a bullish flag/pennant pattern (ascending channel). The index closed at the upper end of the range, after briefly sweeping liquidity on the downside, which suggests a continuation is likely.
Key Levels:
Intraday Supply: 82,300.
Intraday Demand: 81,800 - 81,900.
Outlook: Strongly Bullish.
📈 Trade Plan (Friday, 10th October)
Market Outlook: The Sensex is showing strong underlying strength and is poised to challenge the major resistance. The primary strategy will be to buy on continuation.
Bullish Scenario (Primary Plan)
Justification: The market has confirmed a strong reversal, and the structure is now clearly bullish. Positive IT earnings (if reported) could provide the catalyst for a strong breakout.
Entry: Long entry on a decisive break and 15-minute candle close above 82,300.
Stop Loss (SL): Place a stop loss below 81,900 (below the immediate support).
Targets:
T1: 82,500 (Major supply zone).
T2: 82,800 (Extension target).
Bearish Scenario (Counter-Trend Plan)
Justification: Only valid if TCS results are negative or global cues cause a sharp rejection/gap down.
Trigger: A decisive break and 1-hour candle close below 81,600.
Entry: Short entry below 81,600.
Stop Loss (SL): Above 81,900.
Targets:
T1: 81,300 (Lower channel trendline).
T2: 81,000 (Psychological support).
Key Levels for Observation:
Immediate Decision Point: 82,000 - 82,300 zone.
Bullish Confirmation: A break and sustained move above 82,300.
Bearish Warning: A move below 81,800 suggests the bounce has failed.
Line in the Sand: 81,600. Below this level, the short-term bullish bias is nullified.
Pernyataan Penyangkalan
Informasi dan publikasi tidak dimaksudkan untuk menjadi, dan bukan merupakan saran keuangan, investasi, perdagangan, atau rekomendasi lainnya yang diberikan atau didukung oleh TradingView. Baca selengkapnya di Persyaratan Penggunaan.
Pernyataan Penyangkalan
Informasi dan publikasi tidak dimaksudkan untuk menjadi, dan bukan merupakan saran keuangan, investasi, perdagangan, atau rekomendasi lainnya yang diberikan atau didukung oleh TradingView. Baca selengkapnya di Persyaratan Penggunaan.