🔍 Chart Analysis
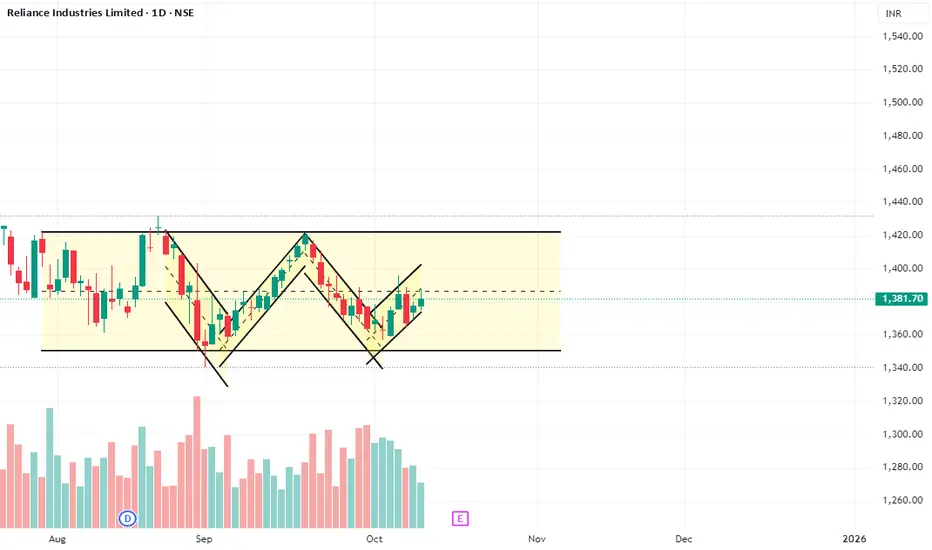
The chart for Reliance Industries Ltd. (RELIANCE) on the Daily timeframe shows the stock trading within a horizontal consolidation range since early August.
Pattern: The price is trapped in a Rectangle Pattern (consolidation range). Within this range, a visible 'W' pattern (Double Bottom) is forming between September and October.
Range Boundaries:
Resistance (Supply Zone): The upper boundary is around ₹1,420 - ₹1,430.
Support (Demand Zone): The lower boundary is around ₹1,345 - ₹1,355.
'W' Pattern Neckline: The neckline for the small 'W' pattern (the high between the two bottoms in September/October) is approximately at ₹1,400.
Current Position: The stock is currently trading just under the 'W' neckline at ₹1,381.70, near the midpoint of the larger consolidation range (indicated by the dashed line).
The Market Structure Shift (MSS) for the overall range would only be confirmed upon a decisive break of the main Resistance or Support. The small 'W' pattern suggests a potential short-term bullish move within the range, aiming for the upper boundary.
📈 Trade Plan (Range Trading & Short-Term Bullish Bias)
The plan has two components: a short-term move based on the 'W' pattern and a longer-term plan for the range breakout.
1. Short-Term Bullish Scenario (Within the Range)
This trade is based on the small 'W' (Double Bottom) pattern completing and pushing the price towards the main range resistance.
Entry Condition: A decisive close (Daily) ABOVE the 'W' Neckline of ₹1,400.
Stop Loss (SL): Place the stop loss below the recent swing low that forms the second bottom of the 'W', for example, around ₹1,365.
Target (T): Target the upper boundary of the main consolidation range at ₹1,420 - ₹1,430.
2. Breakout Plan (MSS Confirmation)
The most significant moves will occur when the stock breaks the main consolidation range.
Confirmed MSS to the Upside (Trend Continuation):
Entry Condition: A Daily close and sustained trade ABOVE ₹1,430 on strong volume. This would confirm the Market Structure Shift (MSS) to the upside.
Target: The minimum measured move would be the height of the range (₹1,430 - ₹1,350 = ₹80) projected upwards, yielding a Target ≈ ₹1,510.
Confirmed MSS to the Downside (Trend Reversal):
Entry Condition: A Daily close and sustained trade BELOW ₹1,350 on strong volume. This would confirm the Market Structure Shift (MSS) to the downside.
Target: The minimum measured move would be the height of the range (₹80) projected downwards, yielding a Target ≈ ₹1,270.
⚠️ Risk Management
Trading at the current price of ₹1,381.70 is risky as it is in the middle of the range.
Priority should be given to waiting for either the 'W' neckline (₹1,400) to break for the short-term target, or for the main range boundaries (₹1,430 or ₹1,350) to break for the larger trend trade. Wait for volume confirmation on all major breakouts.
Trade aktif
T1 is achieved. Book partially. SL to costPernyataan Penyangkalan
The information and publications are not meant to be, and do not constitute, financial, investment, trading, or other types of advice or recommendations supplied or endorsed by TradingView. Read more in the Terms of Use.
Pernyataan Penyangkalan
The information and publications are not meant to be, and do not constitute, financial, investment, trading, or other types of advice or recommendations supplied or endorsed by TradingView. Read more in the Terms of Use.