https://www.tradingview.com/x/mFwswPSt
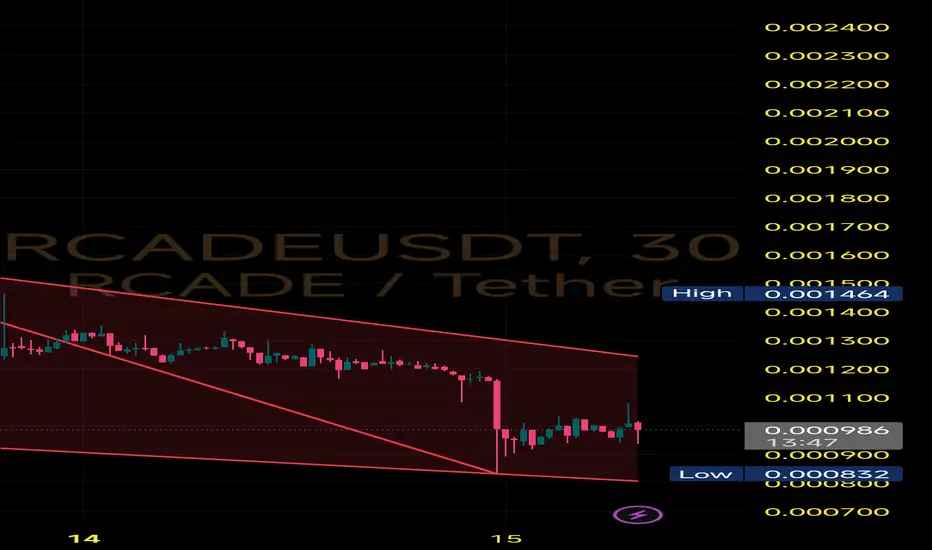
A falling wedge is formed when price makes lower highs and lower lows within converging trendlines. It’s typically a bullish pattern, especially after an extended downtrend like this one.
Current Situation - Price touched the lower wedge boundary at $0.000832 (latest local low)
Multiple taps on both support and resistance trendlines confirm wedge validity
Quick rebound from the wedge bottom hints that buyers are stepping in
🔹Breakout zone above $0.00110–$0.00115 could trigger rapid move
🔸Immediate resistance levels: $0.00130 → $0.00150 → $0.00180
⚠️ Invalidation:
A breakdown below $0.00083 with high volume would invalidate the wedge and resume the downtrend.
Pernyataan Penyangkalan
Informasi dan publikasi tidak dimaksudkan untuk menjadi, dan bukan merupakan saran keuangan, investasi, perdagangan, atau rekomendasi lainnya yang diberikan atau didukung oleh TradingView. Baca selengkapnya di Persyaratan Penggunaan.
Pernyataan Penyangkalan
Informasi dan publikasi tidak dimaksudkan untuk menjadi, dan bukan merupakan saran keuangan, investasi, perdagangan, atau rekomendasi lainnya yang diberikan atau didukung oleh TradingView. Baca selengkapnya di Persyaratan Penggunaan.