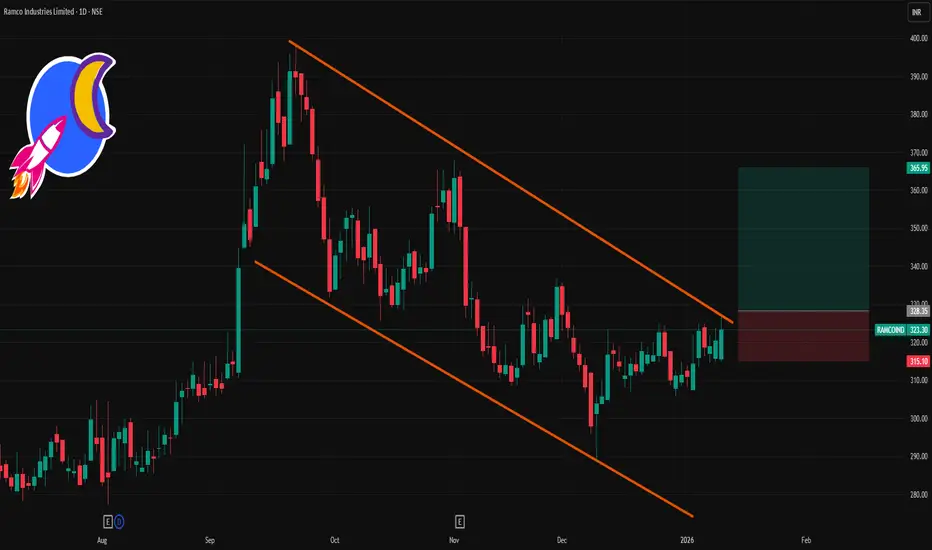
📈 Current Price (Approx Latest Close)
📌 Last Traded / Closing Price: ~₹323.30 on NSE (as of Jan 9, 2026)
📊 Daily Pivot & Support/Resistance Levels
Classic Pivot Levels (Daily)
These are useful for intraday and short‑term directional bias:
Level Price (Approx)
R3 ~₹336.23
R2 ~₹329.12
R1 ~₹321.78
Pivot ~₹314.67
S1 ~₹307.33
S2 ~₹300.22
S3 ~₹292.88
Interpretation:
Above Pivot (~314–315): bullish bias.
Above R1 (~321–322): stronger upside view.
Break above R2 (~329): could shift momentum higher intraday.
Below Pivot: more bears in control.
📌 Alternate Daily Pivot (Standard)
Another reliable pivot view from recent technical data:
Level Price
R3 ~₹324.02
R2 ~₹321.03
R1 ~₹316.62
Pivot ~₹313.63
S1 ~₹309.22
S2 ~₹306.23
S3 ~₹301.82
This set is slightly tighter but confirms similar zones near ₹310–₹322.
📌 How to Use These Levels Today
Bullish below/above strategy:
Bullish view: Price staying above Pivot (~₹314–315) and ideally R1 (~₹321–322) — targets R2 (~₹329) then R3 (~₹336).
Bearish risk: If price fails below Pivot (~₹314), next stops are S1 (~₹307) → S2 (~₹300).
🧾 Summary — 1D Levels Snapshot
Zone Level
Resistance 3 ~₹336
Resistance 2 ~₹329
Resistance 1 ~₹322
Pivot ~₹315
Support 1 ~₹307
Support 2 ~₹300
Support 3 ~₹293
Publikasi terkait
Pernyataan Penyangkalan
Informasi dan publikasi ini tidak dimaksudkan, dan bukan merupakan, saran atau rekomendasi keuangan, investasi, trading, atau jenis lainnya yang diberikan atau didukung oleh TradingView. Baca selengkapnya di Ketentuan Penggunaan.
Publikasi terkait
Pernyataan Penyangkalan
Informasi dan publikasi ini tidak dimaksudkan, dan bukan merupakan, saran atau rekomendasi keuangan, investasi, trading, atau jenis lainnya yang diberikan atau didukung oleh TradingView. Baca selengkapnya di Ketentuan Penggunaan.