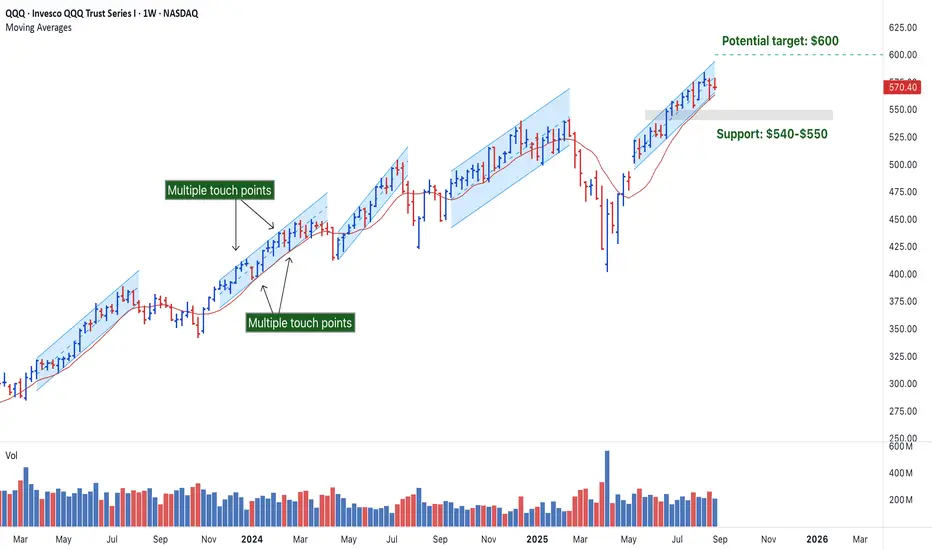
QQQ has been respecting a series of parallel channels since March of 2023, forming a classic stair-step bullish pattern. Each channel ended with a break below the 10-week SMA.
🔸 Strong Trend Structure
▪ The chart shows five clear ascending parallel channels, each followed by a corrective/downward or sideways phase.
▪ This stair-step structure is characteristic of bullish price action, followed by consolidations, which often signals a healthy uptrend.
🔸 Channel Integrity
▪ Each channel respects its upper and lower bounds well, showing consistent buying pressure and trend continuation.
▪ There are multiple touch points for each upper and lower band, showing price support and resistance levels.
▪ The last channel is slightly narrower than the previous ones, which could imply momentum compression before either:
• A breakout (continuation upward).
• A breakdown (channel failure and pullback).
🔸 Risk Zone
▪ If QQQ breaks below the channel support and the 10-week moving average, the next likely support zone is around $540–$550.
🔸 Key Levels
▪ Upside Target: If QQQ breaks above the channel, we could see $600+ based on the measured move of prior legs.
▪ Watch volume for confirmation on any breakout attempt.
▪ Support Zone: If the channel fails, $540–$550 is the first major demand area aligned with prior consolidation.
🔸 Trade Ideas
▪ Bullish Bias: Breakout with strong volume, stop below channel support.
▪ Bearish Bias: Breakdown on confirmed move below channel and moving average.
Note: This is not investment advice. Do your own research before making any trade decisions. Always conduct your own due diligence before investing.
💡 What do you think – continuation or correction? Drop your thoughts in the comments!
Join traders in over 40 countries and LevelUp!
tradingview.com/spaces/LevelUpTools/
tradingview.com/spaces/LevelUpTools/
Pernyataan Penyangkalan
Informasi dan publikasi ini tidak dimaksudkan, dan bukan merupakan, saran atau rekomendasi keuangan, investasi, trading, atau jenis lainnya yang diberikan atau didukung oleh TradingView. Baca selengkapnya di Ketentuan Penggunaan.