Trade Plan 10/18 Post:  PYPL #PYPL
📊 Setup Overview:
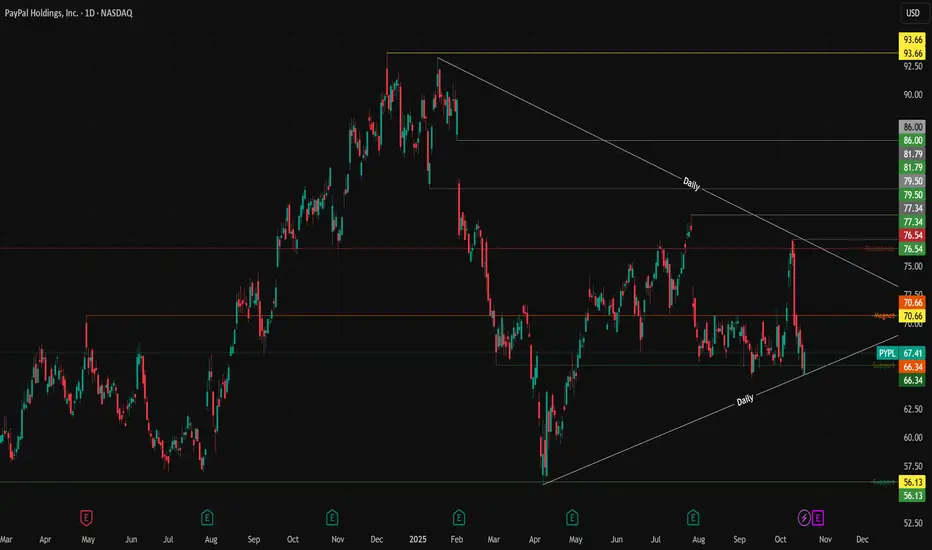
•PYPL is forming a large symmetrical triangle, tightening range between $65.70 support and $70.66 resistance (magnet zone).
• The stock is coiling near the apex, setting up for a potential breakout or breakdown in the coming sessions.
• Momentum remains neutral but leaning bullish while price holds above the rising trendline.
🐂 Bullish Scenario:
• Hold above $65.70 and reclaim $70.66 for upside continuation.
• Breakout above $70.66 targets → $75 → $82 → $93.66.
• Watch volume — confirmation requires expansion above average daily volume.
🐻 Bearish Scenario:
• Lose $65.70 = breakdown from structure.
• Downside targets → $61 → $56.13 → $50.58.
• Sustained close below $56 would confirm a larger bearish trend resumption.
⚖️ Key Levels:
• Resistance → $70.66 / $75 / $82 / $93.66
• Support → $65.71 / $61 / $56.13 / $50.58
🕓 What I’m Watching:
• Confluence between trendline support and horizontal resistance near $68–70 — volatility likely.
• RSI and MACD compression signaling a breakout setup.
• Ideal trade: Wait for confirmation candle above or below the triangle with volume spike.
💬 If you found this helpful, drop a like and comment if you’re watching $PYPL.
Follow
optibiz_trades
for daily setups, breakout alerts, and market analysis!
📊 Setup Overview:
•
• The stock is coiling near the apex, setting up for a potential breakout or breakdown in the coming sessions.
• Momentum remains neutral but leaning bullish while price holds above the rising trendline.
🐂 Bullish Scenario:
• Hold above $65.70 and reclaim $70.66 for upside continuation.
• Breakout above $70.66 targets → $75 → $82 → $93.66.
• Watch volume — confirmation requires expansion above average daily volume.
🐻 Bearish Scenario:
• Lose $65.70 = breakdown from structure.
• Downside targets → $61 → $56.13 → $50.58.
• Sustained close below $56 would confirm a larger bearish trend resumption.
⚖️ Key Levels:
• Resistance → $70.66 / $75 / $82 / $93.66
• Support → $65.71 / $61 / $56.13 / $50.58
🕓 What I’m Watching:
• Confluence between trendline support and horizontal resistance near $68–70 — volatility likely.
• RSI and MACD compression signaling a breakout setup.
• Ideal trade: Wait for confirmation candle above or below the triangle with volume spike.
💬 If you found this helpful, drop a like and comment if you’re watching $PYPL.
Follow
optibiz_trades
for daily setups, breakout alerts, and market analysis!
Pernyataan Penyangkalan
Informasi dan publikasi tidak dimaksudkan untuk menjadi, dan bukan merupakan saran keuangan, investasi, perdagangan, atau rekomendasi lainnya yang diberikan atau didukung oleh TradingView. Baca selengkapnya di Persyaratan Penggunaan.
Pernyataan Penyangkalan
Informasi dan publikasi tidak dimaksudkan untuk menjadi, dan bukan merupakan saran keuangan, investasi, perdagangan, atau rekomendasi lainnya yang diberikan atau didukung oleh TradingView. Baca selengkapnya di Persyaratan Penggunaan.