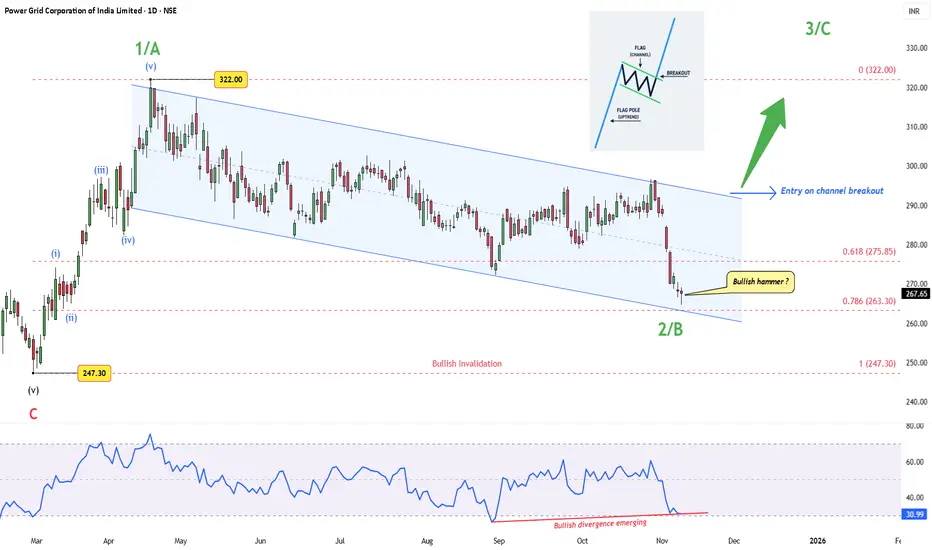
After completing a clean five-wave rally from ₹247.30 to ₹322, Power Grid has spent months in a controlled drift lower — a textbook corrective channel, likely forming Wave 2/B of the next major leg.
Price now sits near the 0.786 retracement (₹263 zone), showing early signs of exhaustion. A “Bullish hammer?” candle has appeared — not textbook-perfect, but hinting that buyers are starting to show up near prior demand.
The RSI divergence adds another layer — price made new lows, RSI didn’t. That’s often how momentum bottoms quietly form before a sharp reversal.
Still, price hasn’t kissed the lower boundary of the channel, which has already acted as support thrice. So, another quick dip can’t be ruled out before a stronger move unfolds.
A breakout above the upper channel would confirm the end of this correction and signal the start of Wave 3/C, with ₹322 as the first key level to reclaim.
Until then, patience is key — the structure remains healthy, the confluence is strong, and the risk is clearly defined.
Structure summary:
Disclaimer: This analysis is for educational purposes only and does not constitute investment advice. Please do your own research (DYOR) before making any trading decisions.
Price now sits near the 0.786 retracement (₹263 zone), showing early signs of exhaustion. A “Bullish hammer?” candle has appeared — not textbook-perfect, but hinting that buyers are starting to show up near prior demand.
The RSI divergence adds another layer — price made new lows, RSI didn’t. That’s often how momentum bottoms quietly form before a sharp reversal.
Still, price hasn’t kissed the lower boundary of the channel, which has already acted as support thrice. So, another quick dip can’t be ruled out before a stronger move unfolds.
A breakout above the upper channel would confirm the end of this correction and signal the start of Wave 3/C, with ₹322 as the first key level to reclaim.
Until then, patience is key — the structure remains healthy, the confluence is strong, and the risk is clearly defined.
Structure summary:
- Wave 1/A: ₹247.30 → ₹322
- Wave 2/B: Descending flag-type correction
- Key fibs: 0.618 = ₹275.85, 0.786 = ₹263.30
- RSI: Bullish divergence emerging
- Trigger: Breakout above channel
- Invalidation: Below ₹247
Disclaimer: This analysis is for educational purposes only and does not constitute investment advice. Please do your own research (DYOR) before making any trading decisions.
WaveXplorer | Elliott Wave insights
📊 X profile: @veerappa89
📊 X profile: @veerappa89
Publikasi terkait
Pernyataan Penyangkalan
Informasi dan publikasi ini tidak dimaksudkan, dan bukan merupakan, saran atau rekomendasi keuangan, investasi, trading, atau jenis lainnya yang diberikan atau didukung oleh TradingView. Baca selengkapnya di Ketentuan Penggunaan.