📊 Key Technical Indicators
Relative Strength Index (RSI): The 14-day RSI is approximately 59.6, suggesting the stock is neither overbought nor oversold, indicating a neutral stance.
Moving Averages:
20-day Simple Moving Average (SMA): 113.73 (bullish)
50-day SMA: 113.61 (bullish)
200-day SMA: 113.87 (bearish)
20-day Exponential Moving Average (EMA): 113.75 (bullish)
50-day EMA: 113.66 (bullish)
200-day EMA: 113.97 (bearish)
Moving Average Convergence Divergence (MACD): The MACD is positive, indicating bullish momentum.
Commodity Channel Index (CCI): The CCI is at 462.41, which is considered extremely overbought, suggesting potential for a pullback.
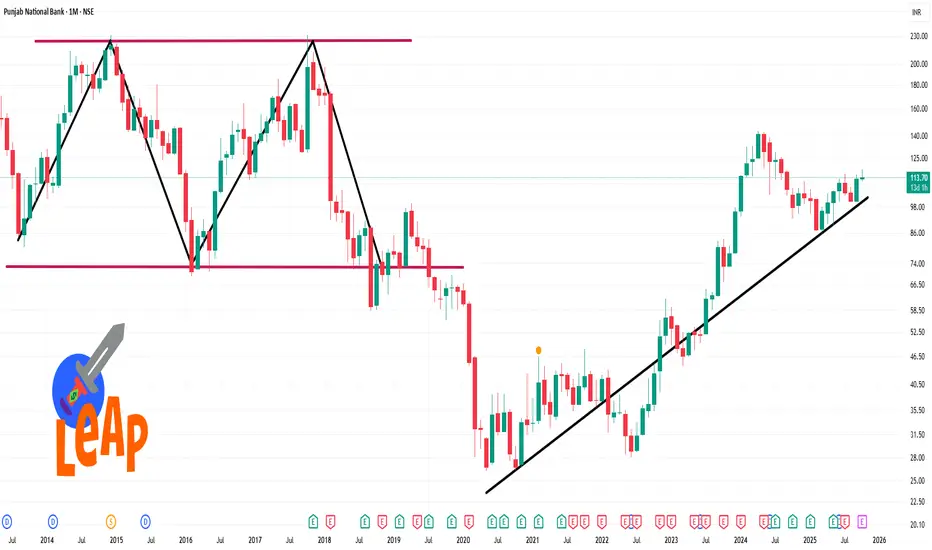
🔍 Support and Resistance Levels
Resistance: 117.24
Support: 111.4
Relative Strength Index (RSI): The 14-day RSI is approximately 59.6, suggesting the stock is neither overbought nor oversold, indicating a neutral stance.
Moving Averages:
20-day Simple Moving Average (SMA): 113.73 (bullish)
50-day SMA: 113.61 (bullish)
200-day SMA: 113.87 (bearish)
20-day Exponential Moving Average (EMA): 113.75 (bullish)
50-day EMA: 113.66 (bullish)
200-day EMA: 113.97 (bearish)
Moving Average Convergence Divergence (MACD): The MACD is positive, indicating bullish momentum.
Commodity Channel Index (CCI): The CCI is at 462.41, which is considered extremely overbought, suggesting potential for a pullback.
🔍 Support and Resistance Levels
Resistance: 117.24
Support: 111.4
Publikasi terkait
Pernyataan Penyangkalan
Informasi dan publikasi ini tidak dimaksudkan, dan bukan merupakan, saran atau rekomendasi keuangan, investasi, trading, atau jenis lainnya yang diberikan atau didukung oleh TradingView. Baca selengkapnya di Ketentuan Penggunaan.
Publikasi terkait
Pernyataan Penyangkalan
Informasi dan publikasi ini tidak dimaksudkan, dan bukan merupakan, saran atau rekomendasi keuangan, investasi, trading, atau jenis lainnya yang diberikan atau didukung oleh TradingView. Baca selengkapnya di Ketentuan Penggunaan.