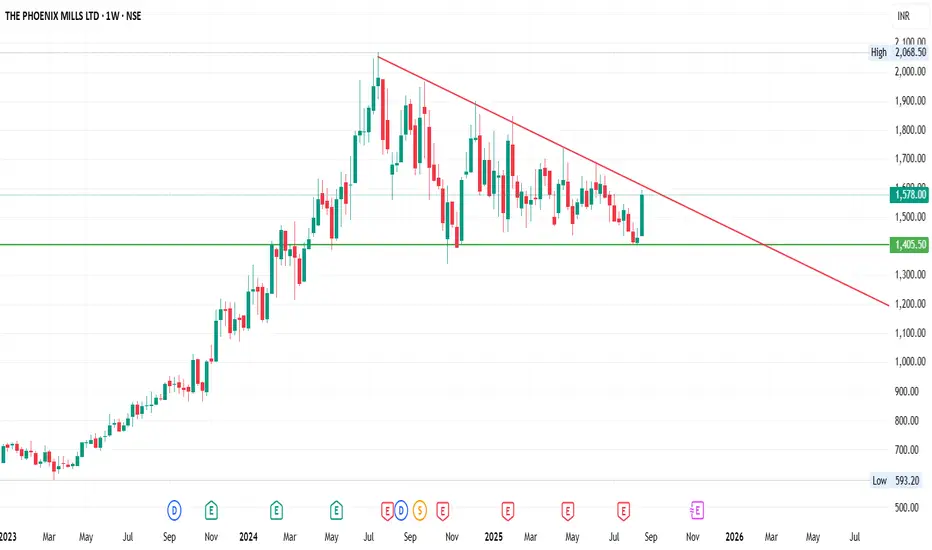
Chart Pattern: On the weekly chart, Phoenix Ltd. is forming a triangle consolidation pattern after a strong prior uptrend.
Technical View
Support Zone: ₹1400 (strong base, tested multiple times).
Resistance Trendline: Descending resistance capping the upside.
Volume: Watch for a surge in volume to confirm breakout direction.
Breakout Levels:
What do you think? Will Phoenix Ltd. break upwards or downwards? Drop your views below!
Disclaimer: This analysis is for educational purposes only, not financial advice. Please do your own research before investing.
- The descending trendline (red) is acting as resistance.
- A strong horizontal support zone near ₹1400 (green) has been tested multiple times, showing buyers’ interest at this level.
- Price action is currently squeezing inside the triangle, indicating that a big breakout move may be near.
Technical View
Support Zone: ₹1400 (strong base, tested multiple times).
Resistance Trendline: Descending resistance capping the upside.
Volume: Watch for a surge in volume to confirm breakout direction.
Breakout Levels:
- Bullish breakout above the descending trendline could open up targets towards ₹1600–₹1700.
- Be
What do you think? Will Phoenix Ltd. break upwards or downwards? Drop your views below!
Disclaimer: This analysis is for educational purposes only, not financial advice. Please do your own research before investing.
Pernyataan Penyangkalan
Informasi dan publikasi ini tidak dimaksudkan, dan bukan merupakan, saran atau rekomendasi keuangan, investasi, trading, atau jenis lainnya yang diberikan atau didukung oleh TradingView. Baca selengkapnya di Ketentuan Penggunaan.
Pernyataan Penyangkalan
Informasi dan publikasi ini tidak dimaksudkan, dan bukan merupakan, saran atau rekomendasi keuangan, investasi, trading, atau jenis lainnya yang diberikan atau didukung oleh TradingView. Baca selengkapnya di Ketentuan Penggunaan.