Cup and handle pattern + rising triangle on daily
✨️ EIPICO Pharmaceuticals (PHAR)
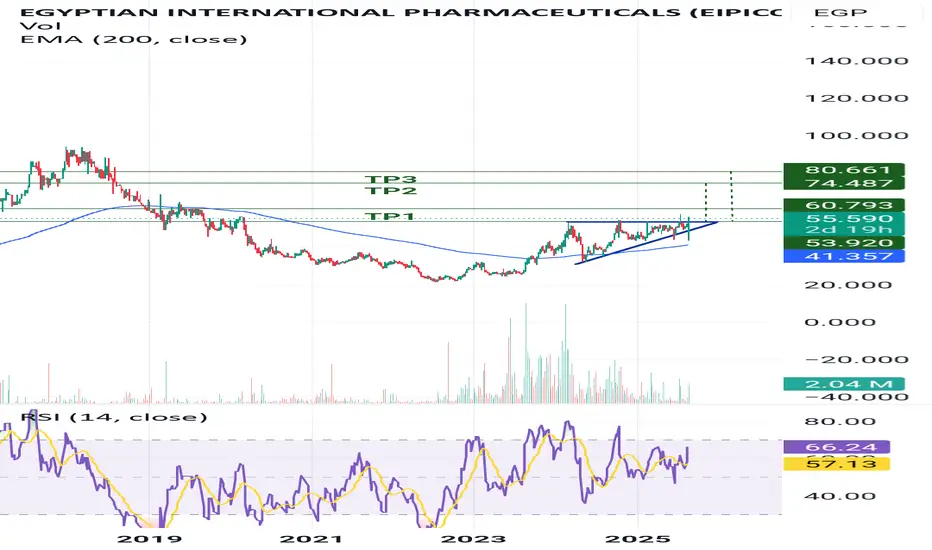
The stock has formed a cup and handle pattern on the weekly chart. On the daily chart, a rising triangle has also been confirmed, with today’s breakout above both patterns supported by the highest trading volume in the past 8 months.
If the stock manages to hold above 54, it will be positioned for the following targets:
Short-term: 60
Medium to long-term: 74 – 80 (targets of both chart patterns)
⚠️ Currently, the 54 level serves as the stop-loss. In case of a close below it, stop-loss should be activated to protect capital.
Trading Plan:
Stock Code: PHAR
Potential Buy Range: 54 – 55.7
TP1: 60
TP2: 74
TP3: 80
Stop-Loss: 54 (confirmation required)
Trailing stop-loss is recommended
Pernyataan Penyangkalan
Informasi dan publikasi tidak dimaksudkan untuk menjadi, dan bukan merupakan saran keuangan, investasi, perdagangan, atau rekomendasi lainnya yang diberikan atau didukung oleh TradingView. Baca selengkapnya di Persyaratan Penggunaan.
Pernyataan Penyangkalan
Informasi dan publikasi tidak dimaksudkan untuk menjadi, dan bukan merupakan saran keuangan, investasi, perdagangan, atau rekomendasi lainnya yang diberikan atau didukung oleh TradingView. Baca selengkapnya di Persyaratan Penggunaan.