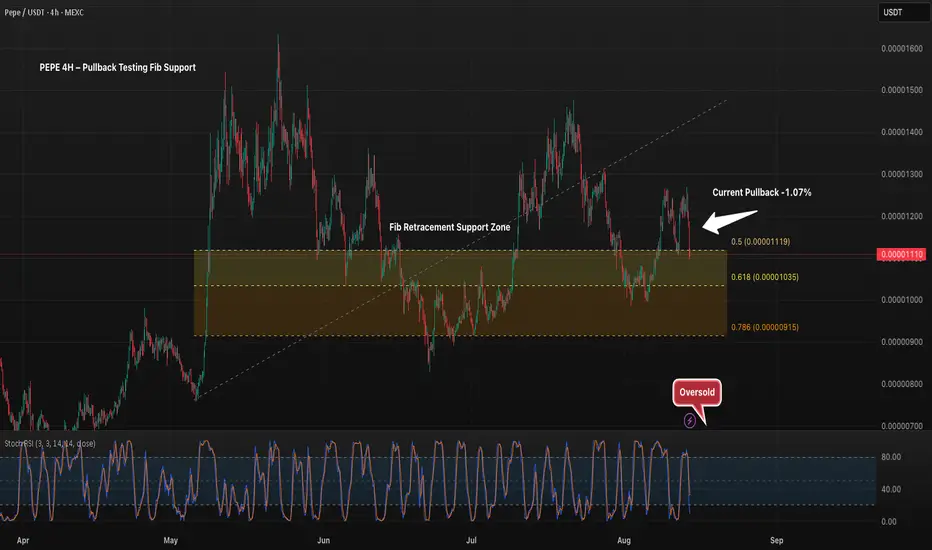
PEPE’s 4H chart shows price pulling back into the 0.5 Fibonacci retracement level near 0.00001119, with the next supports at 0.618 (0.00001035) and 0.786 (0.00000915). Stoch RSI is in oversold territory, signaling potential for a short-term bounce. A sustained hold above the 0.5 level could keep bullish momentum intact, while a breakdown increases risk of deeper retracement.
Explore 5,000 Strategies at quanttradingpro.com
Search for the most profitable, lowest risk by symbol!
Search by indicators like Supertrend, Ichimoku, macd.
Join our discord discord.gg/2systG9frc
We provide education & tools.
Search for the most profitable, lowest risk by symbol!
Search by indicators like Supertrend, Ichimoku, macd.
Join our discord discord.gg/2systG9frc
We provide education & tools.
Pernyataan Penyangkalan
Informasi dan publikasi tidak dimaksudkan untuk menjadi, dan bukan merupakan saran keuangan, investasi, perdagangan, atau rekomendasi lainnya yang diberikan atau didukung oleh TradingView. Baca selengkapnya di Persyaratan Penggunaan.