Optimism (OP) is standing at a critical crossroads after a long and steady downtrend that has persisted since mid-2024.
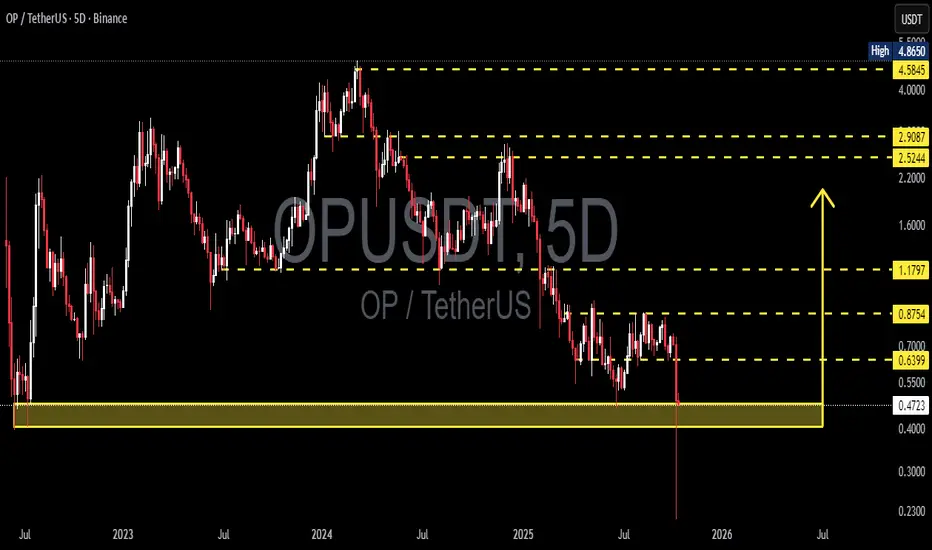
Price is now testing the major support zone between 0.405–0.476 (yellow block) — a historical demand area that once marked the beginning of a major rally in the past.
The deep wick below this area indicates a liquidity sweep, suggesting that larger players may have flushed out retail stop-losses before positioning for the next major move.
This zone is not just a number — it represents the psychological line between capitulation and accumulation.
While the macro structure still shows lower highs and lower lows, the reaction in this support range will determine whether a mid-term reversal can begin or if the macro downtrend continues.
---
Pattern & Structure Analysis
Main trend: Bearish, with continuous lower highs and lower lows.
Yellow block (0.405–0.476): Key historical demand zone that previously triggered strong accumulation.
Long wick below: Possible false breakdown or stop hunt, indicating liquidity absorption.
Potential setup: Early formation of a double-bottom pattern if price holds above 0.405 and reclaims higher resistance.
---
Bullish Scenario
If price strongly bounces from 0.405–0.476 and successfully closes above 0.6399 (5D timeframe), it could confirm the start of a mid-term reversal.
Initial target: 0.8754
Next target: 1.1797
Bullish confirmation: 5D close above 0.6399 with rising volume.
Invalidation: 5D close below 0.405.
This zone offers potential accumulation for swing traders, but confirmation from volume and structure is essential before committing.
---
Bearish Scenario
If OP fails to hold 0.405 and closes below this support zone, the bearish momentum will likely accelerate.
First target: 0.23 (previous liquidity sweep low).
Bearish confirmation: 5D close below 0.405 with strong selling volume.
Invalidation: 5D reclaim above 0.6399.
A clean breakdown would confirm a continuation of the macro downtrend, signaling a deeper capitulation phase.
---
Market Narrative
The 0.405–0.476 zone is where buyers and sellers face their final test.
This is the battlefield between smart money accumulation and bearish momentum exhaustion.
A strong bullish reaction here could indicate that smart money is stepping in, while a failure to hold could lead to the final flush before a long consolidation phase.
This is the zone that will define whether OP finds its true bottom or enters another leg down.
---
Technical Summary
Support zone: 0.405–0.476
Nearest resistance: 0.6399
Bullish targets: 0.8754 → 1.1797
Bearish target: 0.23
Main trend: Bearish
Timeframe: 5D (mid-term outlook)
---
#OP #Optimism #OPUSDT #CryptoAnalysis #TechnicalAnalysis #PriceAction #SupportAndResistance #CryptoTrading #MarketStructure #SupplyDemand #CryptoOutlook #BullishScenario #BearishScenario #AltcoinAnalysis
✅ Get Free Signals! Join Our Telegram Channel Here: t.me/TheCryptoNuclear
✅ Twitter: twitter.com/crypto_nuclear
✅ Join Bybit : partner.bybit.com/b/nuclearvip
✅ Benefits : Lifetime Trading Fee Discount -50%
✅ Twitter: twitter.com/crypto_nuclear
✅ Join Bybit : partner.bybit.com/b/nuclearvip
✅ Benefits : Lifetime Trading Fee Discount -50%
Pernyataan Penyangkalan
Informasi dan publikasi ini tidak dimaksudkan, dan bukan merupakan, saran atau rekomendasi keuangan, investasi, trading, atau jenis lainnya yang diberikan atau didukung oleh TradingView. Baca selengkapnya di Ketentuan Penggunaan.