OONDO/USDT – 3D Chart Analysis (Fractal-Based Outlook)
🔰 Pattern Recognition & Fractal Analysis:
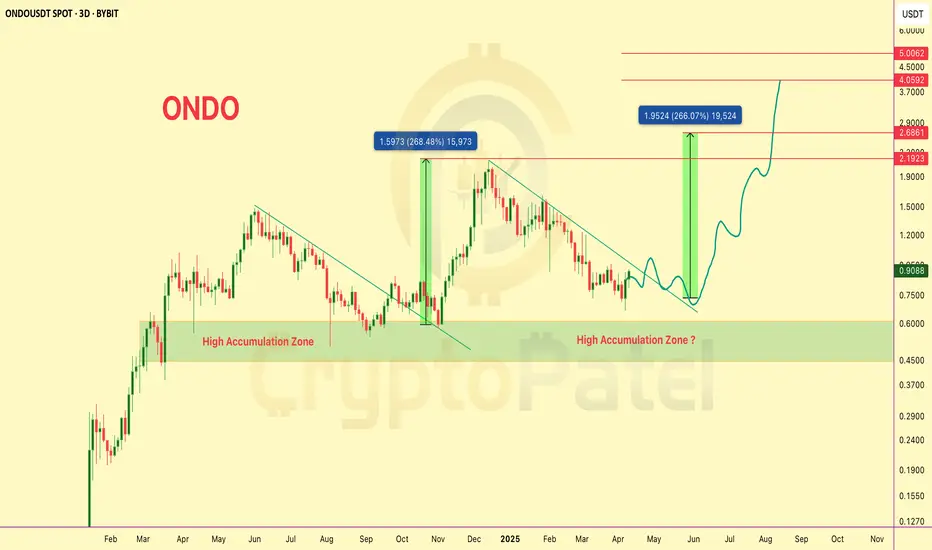
▪️ ONDO previously broke out from a falling wedge pattern in late Q4 2024, resulting in a +268% rally.
▪️ Current price action mirrors that historical fractal, again forming a descending channel with strong demand visible around the $0.60–$0.45 zone — marked as a High Accumulation Zone.
🔰 Current Market Structure:
▪️ Price has respected the descending resistance trendline and now shows signs of breakout attempt.
▪️ A recent bullish engulfing candle near the lower boundary of the accumulation zone suggests potential reversal.
▪️ Volume is picking up, aligning with previous breakout volume behavior.
🔰 Key Technical Zones:
▪️ Accumulation Zone: $0.60 – $0.45
▪️ Immediate Resistance: $1.20 (psychological)
▪️ Breakout Confirmation: Weekly close above $1.30
▪️ Fibonacci Extensions:
1.618 Fib Target: $2.18
2.618 Fib Target: $2.68
Final Bullish Extension: $4.05–$5.00 zone
🔰 Future Projection (Fractal Repeat):
▪️ If breakout mirrors previous fractal, expect ~266% upside — targeting $2.60+ in the next 2–3 months.
▪️ Intermediate pullbacks likely near $1.50 and $2.20 due to historical liquidity zones.
⚠️ Risk Management Note:
▪️ Invalidity below $0.45. If price fails to hold the current range, possible revisit to $0.30–$0.25 range.
▪️ Traders should monitor for volume confirmation and potential bullish divergence on LTFs (Lower Timeframes).
📌 For more real-time analysis, stay tuned. More fractal setups dropping soon.
🔰 Pattern Recognition & Fractal Analysis:
▪️ ONDO previously broke out from a falling wedge pattern in late Q4 2024, resulting in a +268% rally.
▪️ Current price action mirrors that historical fractal, again forming a descending channel with strong demand visible around the $0.60–$0.45 zone — marked as a High Accumulation Zone.
🔰 Current Market Structure:
▪️ Price has respected the descending resistance trendline and now shows signs of breakout attempt.
▪️ A recent bullish engulfing candle near the lower boundary of the accumulation zone suggests potential reversal.
▪️ Volume is picking up, aligning with previous breakout volume behavior.
🔰 Key Technical Zones:
▪️ Accumulation Zone: $0.60 – $0.45
▪️ Immediate Resistance: $1.20 (psychological)
▪️ Breakout Confirmation: Weekly close above $1.30
▪️ Fibonacci Extensions:
1.618 Fib Target: $2.18
2.618 Fib Target: $2.68
Final Bullish Extension: $4.05–$5.00 zone
🔰 Future Projection (Fractal Repeat):
▪️ If breakout mirrors previous fractal, expect ~266% upside — targeting $2.60+ in the next 2–3 months.
▪️ Intermediate pullbacks likely near $1.50 and $2.20 due to historical liquidity zones.
⚠️ Risk Management Note:
▪️ Invalidity below $0.45. If price fails to hold the current range, possible revisit to $0.30–$0.25 range.
▪️ Traders should monitor for volume confirmation and potential bullish divergence on LTFs (Lower Timeframes).
📌 For more real-time analysis, stay tuned. More fractal setups dropping soon.
Twitter: twitter.com/CryptoPatel
Telegram: t.me/OfficialCryptoPatel
Instagram: instagram.com/cryptopatel?utm_medium=copy_link
Telegram: t.me/OfficialCryptoPatel
Instagram: instagram.com/cryptopatel?utm_medium=copy_link
Pernyataan Penyangkalan
Informasi dan publikasi ini tidak dimaksudkan, dan bukan merupakan, saran atau rekomendasi keuangan, investasi, trading, atau jenis lainnya yang diberikan atau didukung oleh TradingView. Baca selengkapnya di Ketentuan Penggunaan.