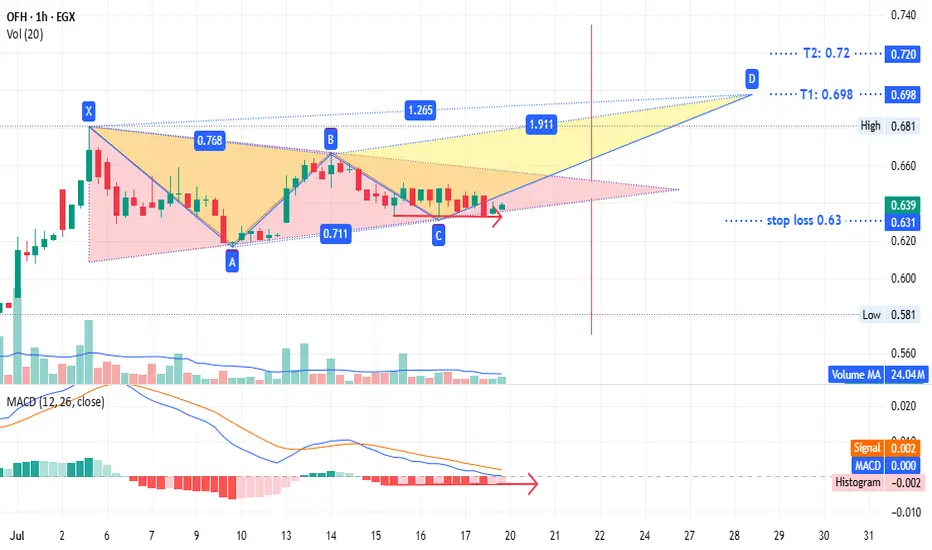
showing a potential triangle pattern with targets at
0.72 if prices close above the upper line or
0.57 if they close below the lower line.
Alternatively, a bearish pattern could target 0.698 to 0.72.
The stop loss is set at 0.63 to 0.624 (the gap from July 13) based on your strategy.
A long position here offers low risk (2% loss vs. ~10% profit potential).
This is not investment advice—only my chart analysis. Consult your account manager before investing. Good luck.
Catatan
The triangle pattern is confirmed; the target is now 0.72 for a new high. Good luck.Trade aktif
amazing all targets achieved
last target at 0.735
if prices closed over 0.745 rebuy what you sell
good luck
Trading ditutup: target tercapai
all targets achieved for all patterns now we have a bearish pattern sell around 0.72
rebuy if prices closed over 0.745
T1: 0.695
T2: 0.665
This is not investment advice—only my chart analysis. Consult your account manager before investing. Good luck.
Pernyataan Penyangkalan
Informasi dan publikasi tidak dimaksudkan untuk menjadi, dan bukan merupakan saran keuangan, investasi, perdagangan, atau rekomendasi lainnya yang diberikan atau didukung oleh TradingView. Baca selengkapnya di Persyaratan Penggunaan.
Pernyataan Penyangkalan
Informasi dan publikasi tidak dimaksudkan untuk menjadi, dan bukan merupakan saran keuangan, investasi, perdagangan, atau rekomendasi lainnya yang diberikan atau didukung oleh TradingView. Baca selengkapnya di Persyaratan Penggunaan.