Looking at the recent Fibonacci retracements on Nifty, we’ve observed a pattern where the price tends to reverse from the 0.5 level and move towards the 1.47 extension level. Let’s take a closer look at the last three Fibonacci retracements:
1) 26777 to 23263
2) 24857 to 23460
3) 24857 to 22786
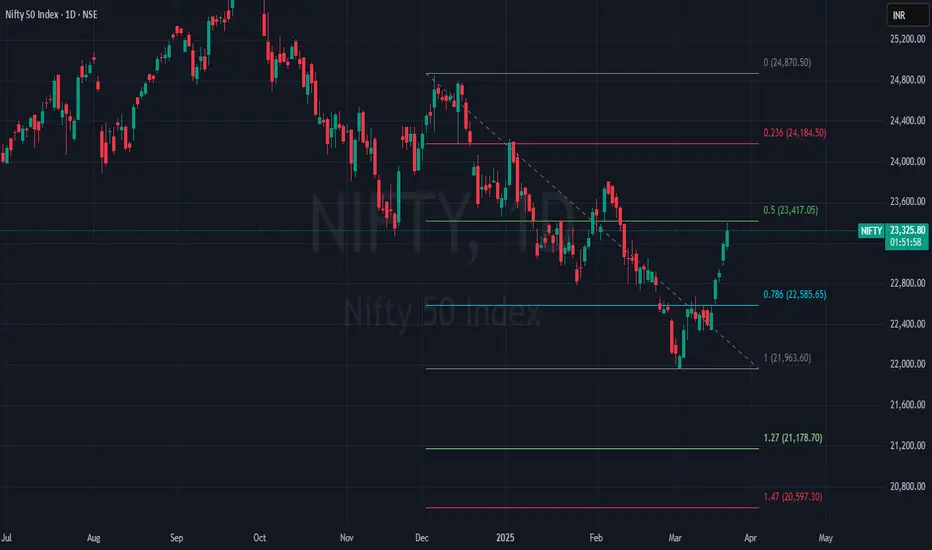
Now, if we plot Fibonacci from 24857 to 21965, the 0.5 level comes out to 23415. As we’ve seen in previous cases, the price tends to return from the 0.5 level.
If Nifty forms a red candle on a daily basis at this level (23415) and the next candle breaks the low of the previous candle, then there is a possibility for Nifty to reach the 1.47 extension level, which is around 20600.
1) 26777 to 23263
2) 24857 to 23460
3) 24857 to 22786
Now, if we plot Fibonacci from 24857 to 21965, the 0.5 level comes out to 23415. As we’ve seen in previous cases, the price tends to return from the 0.5 level.
If Nifty forms a red candle on a daily basis at this level (23415) and the next candle breaks the low of the previous candle, then there is a possibility for Nifty to reach the 1.47 extension level, which is around 20600.
Pernyataan Penyangkalan
Informasi dan publikasi ini tidak dimaksudkan, dan bukan merupakan, saran atau rekomendasi keuangan, investasi, trading, atau jenis lainnya yang diberikan atau didukung oleh TradingView. Baca selengkapnya di Ketentuan Penggunaan.
Pernyataan Penyangkalan
Informasi dan publikasi ini tidak dimaksudkan, dan bukan merupakan, saran atau rekomendasi keuangan, investasi, trading, atau jenis lainnya yang diberikan atau didukung oleh TradingView. Baca selengkapnya di Ketentuan Penggunaan.