NIFTY TRADING PLAN – 13-Oct-2025
📊 Chart Timeframe: 15-Minutes
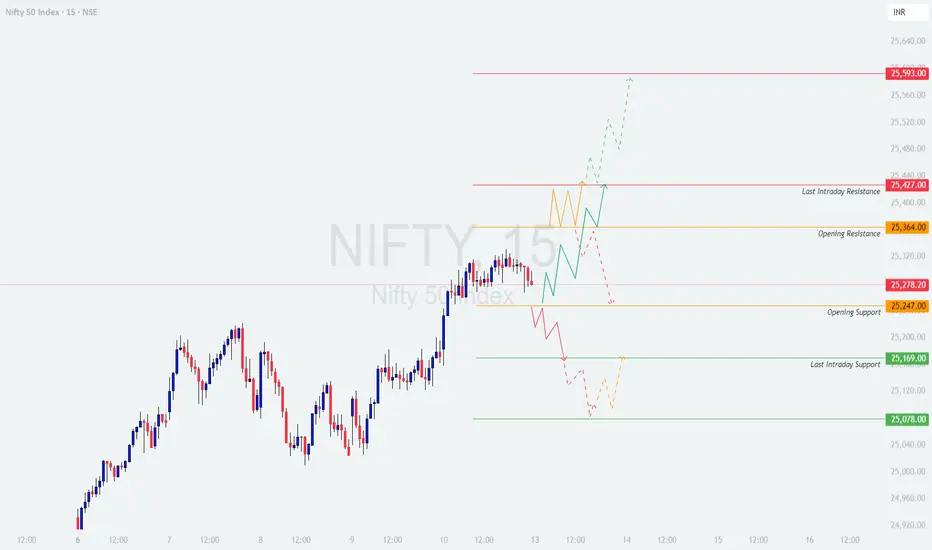
📍 Last Close: 25,278.20 | 🔽 -6.00 pts (-0.02%)
📅 Analysis Type: Psychological + Technical Levels-Based
🔍 Key Technical Levels to Watch
🟥 Last Intraday Resistance: 25,427
🟧 Opening Resistance: 25,364
🟠 Opening Support: 25,247
🟩 Last Intraday Support: 25,169
🟢 Major Support Zone: 25,078
🚀 Scenario 1 – Gap Up Opening (100+ pts above 25,380)
If Nifty opens above 25,380, it will enter a near-resistance zone between 25,364 – 25,427, making the early session crucial for direction confirmation.
💡 Educational Insight:
Gap-up openings near resistance zones often invite emotional buying. Wait for the market to confirm strength through structure — not just price. Watch volume and candle behavior closely before acting.
⚖️ Scenario 2 – Flat Opening (Around 25,250 ± 50 pts)
A flat opening around the previous close keeps Nifty within the decision zone between 25,247 – 25,364.
🧠 Educational Tip:
Flat openings give the best opportunity to follow structure-based breakouts. Don’t predict — let price action dictate direction. Wait for a clear breakout above 25,364 or breakdown below 25,169 for a decisive trade setup.
📉 Scenario 3 – Gap Down Opening (100+ pts below 25,180)
If Nifty opens below 25,180, sentiment will lean negative, but watch how it reacts near the 25,078 major support zone.
💬 Educational Note:
Gap-down openings near major support often create traps. Let confirmation come through a strong close — don’t rely solely on the first few minutes of panic or excitement.
🛡️ Risk Management Tips for Options Traders
📊 Summary & Conclusion
🎯 Focus Zones for 13-Oct-2025:
🟩 Buyers’ Zone: 25,169 → 25,078
🟥 Sellers’ Zone: 25,364 → 25,427
📢 Disclaimer:
I am not a SEBI-registered analyst. This analysis is meant purely for educational and informational purposes. Traders are advised to perform their own research or consult a certified financial advisor before making trading decisions.
📊 Chart Timeframe: 15-Minutes
📍 Last Close: 25,278.20 | 🔽 -6.00 pts (-0.02%)
📅 Analysis Type: Psychological + Technical Levels-Based
🔍 Key Technical Levels to Watch
🟥 Last Intraday Resistance: 25,427
🟧 Opening Resistance: 25,364
🟠 Opening Support: 25,247
🟩 Last Intraday Support: 25,169
🟢 Major Support Zone: 25,078
🚀 Scenario 1 – Gap Up Opening (100+ pts above 25,380)
If Nifty opens above 25,380, it will enter a near-resistance zone between 25,364 – 25,427, making the early session crucial for direction confirmation.
- []In case the index sustains above 25,427 for 15–30 minutes with supportive volume, it could trigger a momentum rally toward 25,520–25,593 levels.
[]Avoid aggressive long entries immediately at open — instead, wait for a controlled pullback or retest near 25,364–25,400, which can offer a low-risk long entry zone.
[]If rejection candles appear near 25,427, it may indicate short-term profit booking. In that case, downside retracement toward 25,247 can occur.
[]A sustained failure to hold above 25,364 post-gap-up could turn the session choppy, so trade with confirmation.]
💡 Educational Insight:
Gap-up openings near resistance zones often invite emotional buying. Wait for the market to confirm strength through structure — not just price. Watch volume and candle behavior closely before acting.
⚖️ Scenario 2 – Flat Opening (Around 25,250 ± 50 pts)
A flat opening around the previous close keeps Nifty within the decision zone between 25,247 – 25,364.
- []If Nifty sustains above 25,364, bulls may regain control with upside potential toward 25,427 and then 25,593.
[]Failure to hold above 25,247 can trigger mild profit booking, dragging prices toward 25,169 — the last intraday support.
[]A bounce from 25,169 can act as a low-risk buy setup with strict stop loss below 25,078.
[]If a 15-min candle closes below 25,078, it confirms short-term weakness; sellers can then aim for 25,000–24,950 zones.]
🧠 Educational Tip:
Flat openings give the best opportunity to follow structure-based breakouts. Don’t predict — let price action dictate direction. Wait for a clear breakout above 25,364 or breakdown below 25,169 for a decisive trade setup.
📉 Scenario 3 – Gap Down Opening (100+ pts below 25,180)
If Nifty opens below 25,180, sentiment will lean negative, but watch how it reacts near the 25,078 major support zone.
- []A bounce from 25,078 can offer a relief rally toward 25,169–25,247, especially if short covering kicks in.
[]However, a breakdown and 15-min close below 25,078 may extend weakness toward 24,950–24,900.
[]Avoid chasing shorts aggressively at open — instead, wait for a pullback toward resistance near 25,169–25,200 to re-enter with better risk-reward.
[]The key here is patience — let the initial volatility settle before entering positions.]
💬 Educational Note:
Gap-down openings near major support often create traps. Let confirmation come through a strong close — don’t rely solely on the first few minutes of panic or excitement.
🛡️ Risk Management Tips for Options Traders
- []Limit your risk to 2%–3% of total trading capital per trade.
[]Use 15-min or hourly candle close to confirm breakouts and stop losses.
[]Trade ATM or slightly ITM options to minimize time decay.
[]Avoid over-leveraging during high-volatility gap openings.
[]Consider using spreads (Bull Call / Bear Put) to hedge against rapid time decay.
[]Book partial profits once your trade achieves a 1:1 risk/reward to protect gains. - Avoid holding options beyond 2:45 PM, as theta decay intensifies in the final hour. ⏳]
📊 Summary & Conclusion
- []Nifty continues to hover in a tight consolidation range, with key resistance at 25,427 and support at 25,078.
[]A breakout above 25,427 can trigger fresh bullish momentum toward 25,593, while a breakdown below 25,078 may open the path for 24,950.
[]Patience, disciplined execution, and confirmation-based entries are essential — avoid emotional trading during gap openings.
[]Remember: The best trades are those backed by both structure and timing, not prediction.]
🎯 Focus Zones for 13-Oct-2025:
🟩 Buyers’ Zone: 25,169 → 25,078
🟥 Sellers’ Zone: 25,364 → 25,427
📢 Disclaimer:
I am not a SEBI-registered analyst. This analysis is meant purely for educational and informational purposes. Traders are advised to perform their own research or consult a certified financial advisor before making trading decisions.
Pernyataan Penyangkalan
Informasi dan publikasi tidak dimaksudkan untuk menjadi, dan bukan merupakan saran keuangan, investasi, perdagangan, atau rekomendasi lainnya yang diberikan atau didukung oleh TradingView. Baca selengkapnya di Persyaratan Penggunaan.
Pernyataan Penyangkalan
Informasi dan publikasi tidak dimaksudkan untuk menjadi, dan bukan merupakan saran keuangan, investasi, perdagangan, atau rekomendasi lainnya yang diberikan atau didukung oleh TradingView. Baca selengkapnya di Persyaratan Penggunaan.