📊 NIFTY TRADING PLAN — 03 DEC 2025
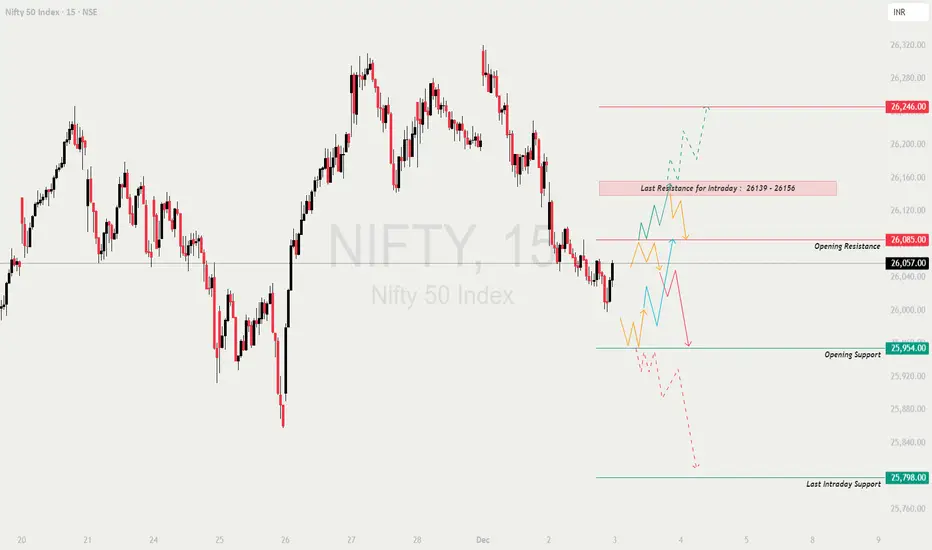
Nifty closed around 26,057, sitting just below the Opening Resistance (26,085) and far from both the day’s support and supply zones.
The chart indicates bearish pressure, but buyers still defend the 25,954 support on dips.
The behaviour at the opening will define whether the index attempts a rebound or continues the downtrend.
🔍 Key Levels For The Day
🟥 Opening Resistance: 26,085
🟥 Last Intraday Resistance: 26,139 – 26,156
🟥 Major Upside Target: 26,246
🟩 Opening Support: 25,954
🟩 Last Intraday Support: 25,798
🟩 Major Breakdown Target: 25,760 – 25,720
🟩 SCENARIO 1 — GAP-UP OPENING (100+ Points)
If Nifty opens near 26,150–26,200, it jumps straight into the resistance zone.
📘 Educational Note:
A gap-up directly into resistance is often a testing zone where institutions check if late buyers will panic.
Let the chart confirm strength before entering.
🟧 SCENARIO 2 — FLAT OPENING (25,980–26,050)
Flat openings create a balanced battlefield between bulls and bears.
💡 Educational Tip:
Flat opens typically lead to a clean breakout after the first 2–3 candles.
Let direction reveal itself instead of predicting it.
🔻 SCENARIO 3 — GAP-DOWN OPENING (100+ Points)
If Nifty opens around 25,920–25,960, it opens near or inside support.
📘 Educational Note:
Gap-downs into support attract smart money buying, but only if the zone holds.
A breakdown usually gives a clean trend day on the downside.
💼 RISK MANAGEMENT TIPS FOR OPTION TRADERS 🔐💡
⚠️ Golden Rule:
Protect capital first.
Exposure without risk control = guaranteed loss.
📌 SUMMARY
Bullish Above:
✔️ 26,085 → 26,139 → 26,156 → 26,200 → 26,246
Bearish Below:
✔️ 25,954 → 25,900 → 25,850 → 25,798 → 25,760
Reversal Zones:
🟩 25,954 (Opening Support)
🟩 25,798 (Intraday Support)
🟥 26,085 (Opening Resistance)
🟥 26,139–26,156 (Key Supply Zone)
Avoid Trading Inside:
⚠️ 26,020–26,070
This is the NOISE zone.
🧾 CONCLUSION
Nifty is set for a decisive day with clear vertical levels.
Trend direction will be driven by:
✔️ Sustaining above 26,085 = Bullish continuation
✔️ Breaking below 25,954 = Fresh downside
✔️ Breakout above 26,156 = Strong rally
✔️ Breakdown below 25,798 = Sharp sell-off
Trade only with confirmation, avoid guessing direction, and focus on clean structure-based entries.
⚠️ DISCLAIMER
I am not a SEBI-registered analyst.
This analysis is purely for educational purposes.
Please consult your financial advisor before making trading decisions.
Nifty closed around 26,057, sitting just below the Opening Resistance (26,085) and far from both the day’s support and supply zones.
The chart indicates bearish pressure, but buyers still defend the 25,954 support on dips.
The behaviour at the opening will define whether the index attempts a rebound or continues the downtrend.
🔍 Key Levels For The Day
🟥 Opening Resistance: 26,085
🟥 Last Intraday Resistance: 26,139 – 26,156
🟥 Major Upside Target: 26,246
🟩 Opening Support: 25,954
🟩 Last Intraday Support: 25,798
🟩 Major Breakdown Target: 25,760 – 25,720
🟩 SCENARIO 1 — GAP-UP OPENING (100+ Points)
If Nifty opens near 26,150–26,200, it jumps straight into the resistance zone.
- []If price sustains above 26,085 → It will attempt the next resistance at:
26,139 → 26,156 → 26,200+
Break & retest above 26,156 gives a drive toward 26,246.
[]If price rejects 26,085–26,139 (upper wicks, strong red candle) →
Expect profit-booking down toward 26,020 → 25,954.
[]Safer Long Setup:
✔️ Breakout above 26,156 + Retest → Target 26,200 / 26,246
[]Early aggressive shorting is risky.
Gap-ups near resistance often create trap candles.
📘 Educational Note:
A gap-up directly into resistance is often a testing zone where institutions check if late buyers will panic.
Let the chart confirm strength before entering.
🟧 SCENARIO 2 — FLAT OPENING (25,980–26,050)
Flat openings create a balanced battlefield between bulls and bears.
- []Upside trigger → Break above 26,085
Targets → 26,139 → 26,156 → 26,200
[]Downside trigger → Break below 25,954
Targets → 25,900 → 25,850 → 25,798
[]Avoid trading inside the tight range 26,020–26,070 — high noise, low reward.
[]Two ideal setups:
✔️ Breakout & Retest above 26,085
✔️ Breakdown & Retest below 25,954
💡 Educational Tip:
Flat opens typically lead to a clean breakout after the first 2–3 candles.
Let direction reveal itself instead of predicting it.
🔻 SCENARIO 3 — GAP-DOWN OPENING (100+ Points)
If Nifty opens around 25,920–25,960, it opens near or inside support.
- []If buyers defend 25,954 and form higher lows →
Reversal targets:
26,020 → 26,057 → 26,085
[]If 25,954 breaks decisively →
Next targets → 25,900 → 25,850 → 25,798
[]Breakdown below 25,798 triggers stronger fall →
Targets → 25,760 → 25,720
[]Reversal trades should only be taken with:
✔️ bullish candle
✔️ higher low
✔️ strong wick rejection
inside the support zone.
📘 Educational Note:
Gap-downs into support attract smart money buying, but only if the zone holds.
A breakdown usually gives a clean trend day on the downside.
💼 RISK MANAGEMENT TIPS FOR OPTION TRADERS 🔐💡
- []Do NOT trade the first 5 minutes after open (avoid traps).
[]Prefer ITM/ATM options for directional moves.
[]Use chart-level SL, not premium-level SL.
[]Avoid averaging losing trades — re-entry is always safer.
[]Trail SL once the trade hits the first target.
[]During high VIX, prefer option spreads. - Avoid overtrading during volatile candle clusters.
⚠️ Golden Rule:
Protect capital first.
Exposure without risk control = guaranteed loss.
📌 SUMMARY
Bullish Above:
✔️ 26,085 → 26,139 → 26,156 → 26,200 → 26,246
Bearish Below:
✔️ 25,954 → 25,900 → 25,850 → 25,798 → 25,760
Reversal Zones:
🟩 25,954 (Opening Support)
🟩 25,798 (Intraday Support)
🟥 26,085 (Opening Resistance)
🟥 26,139–26,156 (Key Supply Zone)
Avoid Trading Inside:
⚠️ 26,020–26,070
This is the NOISE zone.
🧾 CONCLUSION
Nifty is set for a decisive day with clear vertical levels.
Trend direction will be driven by:
✔️ Sustaining above 26,085 = Bullish continuation
✔️ Breaking below 25,954 = Fresh downside
✔️ Breakout above 26,156 = Strong rally
✔️ Breakdown below 25,798 = Sharp sell-off
Trade only with confirmation, avoid guessing direction, and focus on clean structure-based entries.
⚠️ DISCLAIMER
I am not a SEBI-registered analyst.
This analysis is purely for educational purposes.
Please consult your financial advisor before making trading decisions.
Pernyataan Penyangkalan
Informasi dan publikasi ini tidak dimaksudkan, dan bukan merupakan, saran atau rekomendasi keuangan, investasi, trading, atau jenis lainnya yang diberikan atau didukung oleh TradingView. Baca selengkapnya di Ketentuan Penggunaan.
Pernyataan Penyangkalan
Informasi dan publikasi ini tidak dimaksudkan, dan bukan merupakan, saran atau rekomendasi keuangan, investasi, trading, atau jenis lainnya yang diberikan atau didukung oleh TradingView. Baca selengkapnya di Ketentuan Penggunaan.