In previous chart, Expected upsurge accomplished:

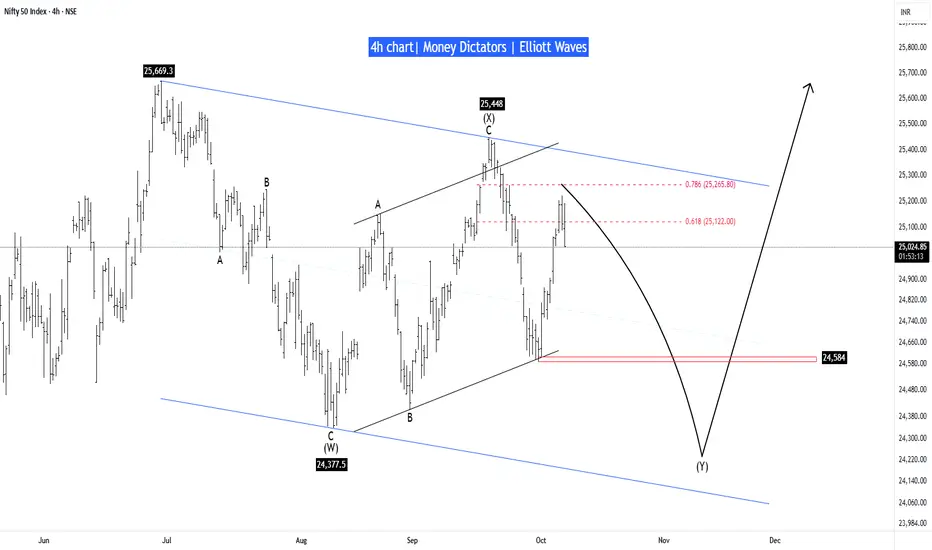
Nifty has reached the optimal supply zone and is expected to decline, at least up to 24,584. The retracement of wave A (0.786) could act as a strong resistance for a reversal. The lower boundary lies at 24,120, while 24,377 marks the low of wave (W). It’s better to consider the lower boundary as the potential maximum downside level.
Once the reversal level is identified, we will proceed toward the bullish path.
Stay tuned!
Money_Dictators
Thanks :)
Life-time free telegram channel - t.me/moneydictators
Publikasi terkait
Pernyataan Penyangkalan
Informasi dan publikasi tidak dimaksudkan untuk menjadi, dan bukan merupakan saran keuangan, investasi, perdagangan, atau rekomendasi lainnya yang diberikan atau didukung oleh TradingView. Baca selengkapnya di Persyaratan Penggunaan.