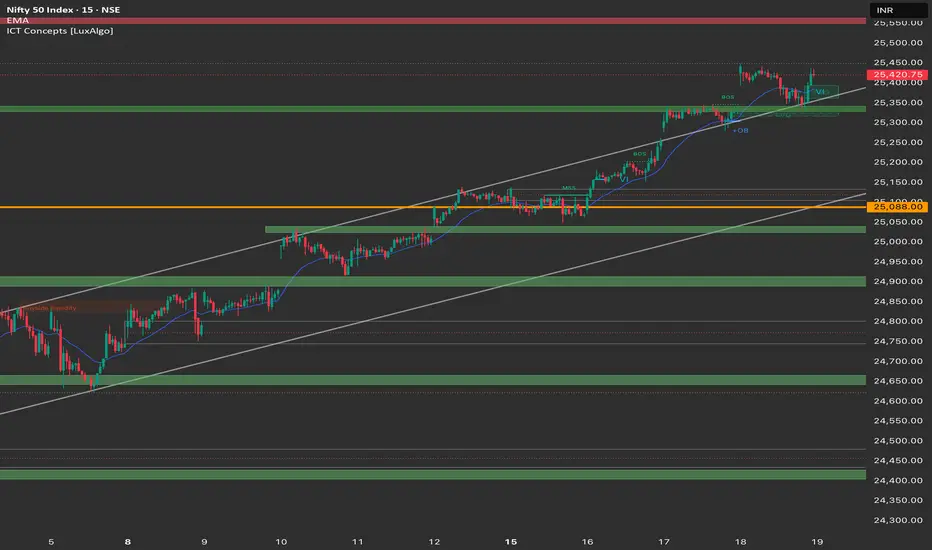
Current NIFTY 50 (Yesterday's Close): 25,423.60
Overarching Theme: The Nifty is in a powerful, well-defined uptrend. The market structure, on a macro level, is unequivocally bullish, with a clear sequence of higher highs and higher lows. This trend is confirmed by the price staying within a rising channel and above key moving averages.
Detailed Market Structure Breakdown
4-Hour Chart (Macro Trend)
Structure: A textbook bullish trend. The price has been respecting an ascending channel since late August. The "Break of Structure" (BOS) near 25,100 was a significant event, confirming the continuation of the uptrend and a shift in the market's bias.
Key Levels:
Major Supply Zone (Resistance): 25,500 - 25,650. This is a critical psychological and technical resistance level. A break above this zone would signal a fresh, strong leg up and a new all-time high.
Major Demand Zone (Support): 25,050 - 25,100. This level is a powerful confluence of a prior breakout resistance and a Fair Value Gap (FVG), making it a high-probability demand zone. Any deep pullback to this area should be seen as a strong buying opportunity.
Outlook: The long-term trend remains firmly bullish. The Nifty's journey towards new highs is intact as long as it stays above its primary support levels.
1-Hour Chart (Intermediate View)
Structure: The 1H chart shows the recent momentum and minor pullbacks. The most recent bounce was a reaction from the 25,250 area, which acted as a solid demand zone. This shows that buyers are stepping in on even minor dips.
Key Levels:
Immediate Resistance: The high of the previous day, near 25,450.
Immediate Support: The 25,300 level, which coincides with the bottom of the rising channel. This is the first line of defense for the bulls today.
Outlook: The 1H chart suggests the market is in a "buy on dips" mode. A bounce from the 25,300 level would be a strong indicator of continued strength.
15-Minute Chart (Intraday View)
Structure: The 15M chart shows that after a strong gap-up and rally, the market has entered a period of consolidation. The price is currently range-bound.
Key Levels:
Intraday Resistance: 25,480. The high of the current consolidation.
Intraday Support: 25,400. The low of the current consolidation.
Outlook: This timeframe is currently neutral, waiting for a breakout. The direction of the break from this range will likely dictate the intraday trend.
📈 Today's Trade Plan (Friday, 19th September)
Market Outlook: The sentiment is bullish, fueled by global cues and domestic buying (DIIs). Nifty is expected to open with a positive bias.
Bullish Scenario (Primary Plan)
Justification: The multi-timeframe analysis is strongly bullish. A breakout from the 15M consolidation and a move towards the 4H chart resistance is the most probable path.
Entry: Place a long entry on a sustained break and 15-minute candle close above 25,480.
Stop Loss (SL): Below 25,400 to protect against a reversal into the previous range.
Targets:
T1: 25,550 (Psychological & minor resistance).
T2: 25,650 (Top of the 4H channel & next major target).
Bearish Scenario (Counter-Trend Plan)
Justification: This plan accounts for a potential fakeout or a deeper-than-expected pullback. It should be traded with caution.
Trigger: A confirmed breakdown and 15-minute candle close below 25,400.
Entry: Short entry on a breakdown retest of the 25,400 level.
Stop Loss (SL): Above 25,450.
Targets:
T1: 25,300 (First major intraday support).
T2: 25,250 (1H chart FVG demand zone).
Key Levels for Observation:
Immediate Decision Point: 25,400 - 25,480.
Bullish Confirmation: A break above 25,480.
Warning Sign: A drop below 25,400 would suggest a short-term correction is underway.
Ultimate Bullish Support: The 25,050 - 25,100 zone is the "line in the sand" for the long-term uptrend. A break below this would invalidate the current bullish structure on the macro chart.
Pernyataan Penyangkalan
Informasi dan publikasi tidak dimaksudkan untuk menjadi, dan bukan merupakan saran keuangan, investasi, perdagangan, atau rekomendasi lainnya yang diberikan atau didukung oleh TradingView. Baca selengkapnya di Persyaratan Penggunaan.
Pernyataan Penyangkalan
Informasi dan publikasi tidak dimaksudkan untuk menjadi, dan bukan merupakan saran keuangan, investasi, perdagangan, atau rekomendasi lainnya yang diberikan atau didukung oleh TradingView. Baca selengkapnya di Persyaratan Penggunaan.