Identification:
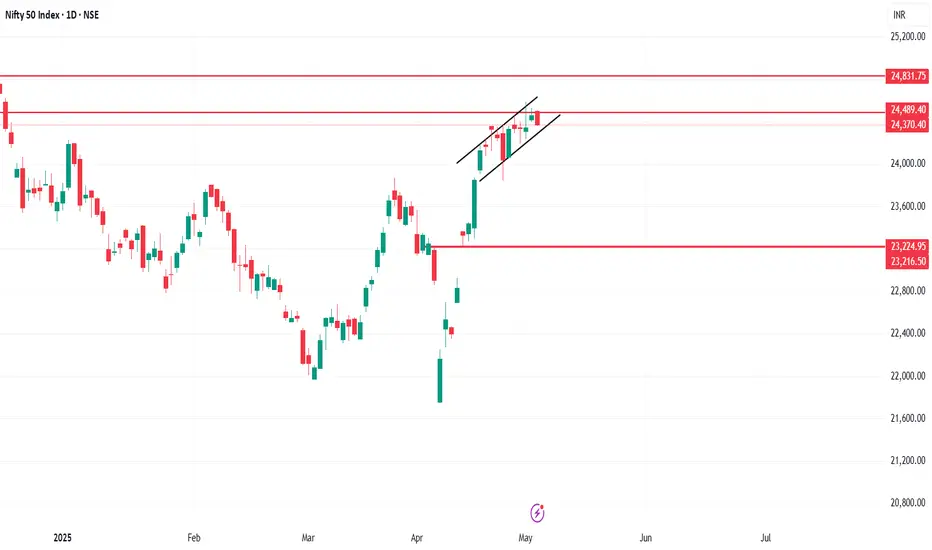
Both trendlines are sloping upwards, forming higher highs and higher lows.
The range is narrowing, with price moving within a converging upward channel.
This is typically considered a bearish reversal pattern, especially when it forms after an uptrend (as in this chart).
🔹 Implications:
If the price breaks down through the lower trendline, it may signal a short opportunity.
After a breakdown, the price target is usually equal to the height of the wedge (from the widest point).
Breakdown confirmation should ideally come with high volume.
🔹 Key Levels (from the chart):
Resistance zone: Around 24,489 – 24,831
Immediate support: Around 24,372 (horizontal)
Major support zone: Around 23,224 – 23,216
🔹 Possible Trade Setup (if breakdown happens):
Sell below: The lower wedge trendline (after candle closes below it)
Target levels: First target ~24,000, second target ~23,200
Stop loss: Just above the recent swing high or upper wedge line
only for educational purpos
Pernyataan Penyangkalan
Informasi dan publikasi tidak dimaksudkan untuk menjadi, dan bukan merupakan saran keuangan, investasi, perdagangan, atau rekomendasi lainnya yang diberikan atau didukung oleh TradingView. Baca selengkapnya di Persyaratan Penggunaan.
Pernyataan Penyangkalan
Informasi dan publikasi tidak dimaksudkan untuk menjadi, dan bukan merupakan saran keuangan, investasi, perdagangan, atau rekomendasi lainnya yang diberikan atau didukung oleh TradingView. Baca selengkapnya di Persyaratan Penggunaan.