Henry Hub Natural Gas Future Weekly Analysis 10-14 June, 24
📈 Henry Hub Natural Gas Future Technical Chart Analysis
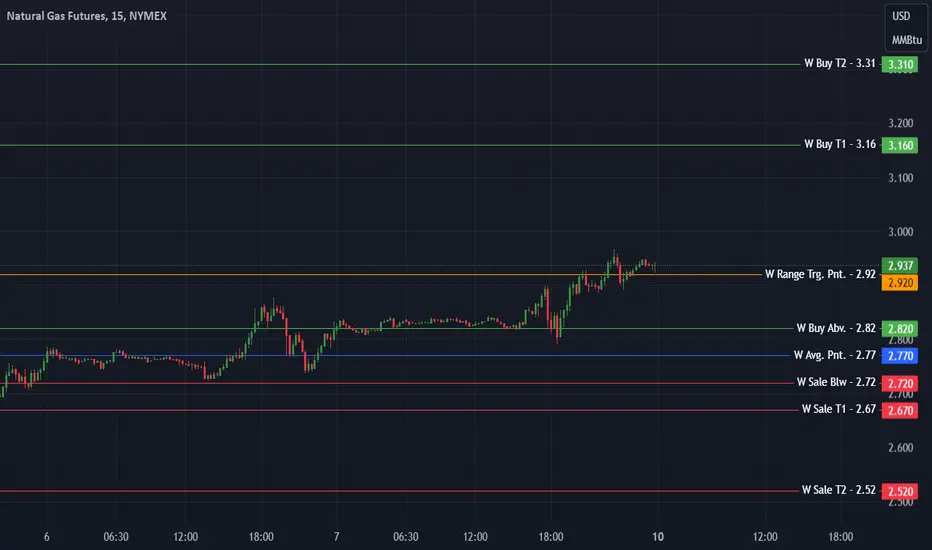
📆 Weekly Levels for 10-14 June, 2024:
📊 Weekly Movement Point: 2.92
📉 Weekly Range: 0.39
📈 Buy Above: 2.82
💼 Average At: 2.77
🎯 Buy Target 1: 3.16
🎯 Buy Target 2: 3.31
🛑 Buyer Stoploss: 2.69
💰 Sale Below: 2.72
🎯 Sale Target 1: 2.67
🎯 Sale Target 2: 2.52
🛑 Seller Stoploss: 2.85
✨ Boost, follow, and engage for more insightful updates. For detailed analysis and live discussions, check out our community channels. Your engagement fuels our dedication to providing top-notch content! 🚀❤️
#HenryHub #NaturalGas #GasFutures #CommoditiesTrading #MarketAnalysis #NG #GasPrices #NatGas #EnergyTrading #MCX #CommoditiesFutures #CommoditiesOptions
Pernyataan Penyangkalan
Informasi dan publikasi tidak dimaksudkan untuk menjadi, dan bukan merupakan saran keuangan, investasi, perdagangan, atau rekomendasi lainnya yang diberikan atau didukung oleh TradingView. Baca selengkapnya di Persyaratan Penggunaan.
Pernyataan Penyangkalan
Informasi dan publikasi tidak dimaksudkan untuk menjadi, dan bukan merupakan saran keuangan, investasi, perdagangan, atau rekomendasi lainnya yang diberikan atau didukung oleh TradingView. Baca selengkapnya di Persyaratan Penggunaan.