# NAS100 Comprehensive Technical Analysis & Daily Trading Strategy
**Current Position**: 23,514.5 (Aug 23, 2025, 12:50 AM UTC+4)
* 🎯 Executive Summary
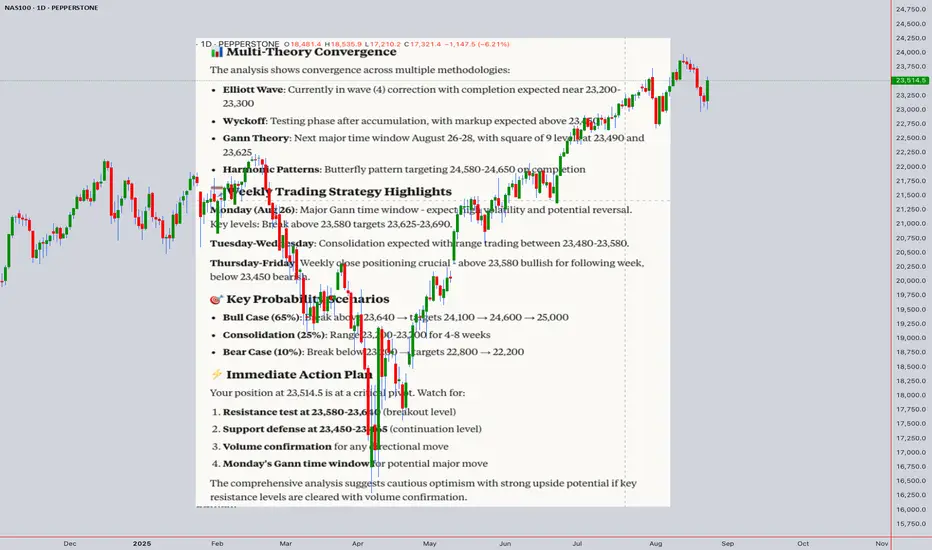
Multi-theory convergence analysis indicates NAS100 at critical inflection point with 65% probability of upward continuation to 24,000-24,600 zone, contingent on breaking 23,640 resistance.
---
# 📊 MULTI-TIMEFRAME TECHNICAL ANALYSIS
**INTRADAY ANALYSIS (5M - 4H)**
**5-Minute Timeframe Analysis**
** Candlestick Patterns
*Current Formation**: Potential inside bar consolidation
*Key Patterns to Watch**: Hammer/Doji near 23,500 (bullish), Shooting star above 23,580 (bearish)
*Volume Confirmation**: Required for breakout validation
** Technical Indicators
*RSI(14)**: ~48-52 (Neutral zone, watch for divergence)
*VWAP**: 23,508 ± 15 (Dynamic S/R level)
*Bollinger Bands**: Squeeze pattern suggesting breakout imminent
*EMA(20)**: 23,495 (immediate support/resistance)
**15-Minute Timeframe Analysis**
** Harmonic Patterns
*Active Pattern**: Potential ABCD completion at 23,350-23,380
*Butterfly Pattern**: Target projection 24,580-24,650
*Fibonacci Confluence**: 61.8% retracement at 23,420
** Wyckoff Analysis
*Phase**: Testing phase after potential accumulation
*Volume**: Decreasing on declines (bullish sign)
*Price Action**: Higher lows formation developing
*Next Expected**: Markup phase if 23,450 holds
**30-Minute Timeframe Analysis**
** Elliott Wave Count
*Primary Count**: Wave (4) correction nearing completion
- Wave A: 23,690 → 23,350
- Wave B: 23,350 → 23,580 (current)
- Wave C Target: 23,200-23,300
*Alternate Count**: Wave (5) impulse beginning
- Target: 24,200-24,600
** W.D. Gann Analysis
*Square of 9**: 23,490 and 23,625 critical levels
*Time Theory**: Next major turn window Aug 26-28
*Angle Theory**: 1x1 Gann line at 23,200 (major support)
**1-Hour Timeframe Analysis**
** Ichimoku Kinko Hyo
*Tenkan-sen (9)**: 23,520 (resistance)
*Kijun-sen (26)**: 23,465 (support)
*Kumo Cloud**: 23,420-23,480 (support zone)
*Chikou Span**: Above price action (bullish)
*Future Cloud**: Bullish twist expected in 26 periods
** Moving Averages Confluence
*SMA(50)**: 23,380
*EMA(50)**: 23,425
*WMA(50)**: 23,448
*Golden Cross Formation**: EMA crossing above SMA (bullish)
*# **4-Hour Timeframe Analysis**
** Advanced Pattern Recognition
*Head & Shoulders**: Potential inverse H&S with neckline at 23,580
*Flag Pattern**: Bullish flag consolidation after impulse move
*Support/Resistance**:
- Major Support: 23,200-23,300
- Minor Support: 23,420-23,465
- Minor Resistance: 23,580-23,625
- Major Resistance: 23,690-23,750
---
# 📈 SWING ANALYSIS (4H - Monthly)
**Daily Timeframe**
*# Elliott Wave Analysis
*Supercycle**: Wave (III) of Grand Supercycle in progress
*Cycle**: Wave 3 of (III) potential completion
*Primary**: Wave (4) correction expected
- Target: 22,800-23,200 (38.2%-50% Fibonacci)
- Duration: 3-8 weeks
- Pattern: Likely flat or triangle
*# Wyckoff Market Structure
*Phase**: Distribution testing vs. Reaccumulation
*Volume Profile**: High volume nodes at 23,300 and 22,800
*Composite Man Activity**: Accumulation signs if above 23,200
*Spring/Upthrust**: Watch for false breakdowns below 23,200
*# Gann Time & Price Forecasting
*Time Cycles**:
- 90-day cycle: Peak expected late August
- 180-day cycle: Next major turn October 2025
*Price Squares**:
- 23,400 = 153² ÷ 10
- 24,000 = 155² ÷ 10
- 25,000 = 158² ÷ 10
**Weekly Timeframe**
*# Long-term Elliott Wave
*Grand Supercycle**: Wave III from 2009 lows
*Supercycle**: Wave (3) extension phase
*Cycle**: Wave 3 of (3) nearing completion at 25,000-26,000
*# Harmonic Analysis
*Shark Pattern**: Completion at 25,200-25,400
*Crab Pattern**: Deep retracement target 20,800-21,500
*ABCD Extensions**: 1.618 projection at 26,000
* **Monthly Timeframe**
*# Macro Elliott Wave Structure
*Primary Degree**: Wave (5) of III in progress
*Intermediate**: Wave 3 of (5) targeting 28,000-30,000
*Minor**: Current correction within larger impulse
*# Gann Annual Forecasting
*2025 Projection**: 24,000-26,000 year-end target
*Seasonal Tendency**: Q4 traditionally strong for tech
*Master Time Cycle**: 7-year cycle supportive through 2026
---
# 📋 KEY LEVELS & TARGETS
**Critical Price Levels**
*# Immediate (Next 48 Hours)
*Ultra Resistance**: 23,690-23,750
*Strong Resistance**: 23,625-23,640
*Minor Resistance**: 23,580-23,600
*Pivot Point**: 23,514 (current)
*Minor Support**: 23,465-23,480
*Strong Support**: 23,420-23,450
*Ultra Support**: 23,350-23,380
*# Short-term (1-2 Weeks)
*Bull Target 1**: 24,100-24,200
*Bull Target 2**: 24,600-24,800
*Bear Target 1**: 23,000-23,100
*Bear Target 2**: 22,600-22,800
*# Medium-term (1-3 Months)
*Primary Upside**: 25,000-25,500
*Extended Upside**: 26,000-26,800
*Primary Downside**: 21,500-22,000
*Extended Downside**: 20,000-20,500
---
# 📅 DAILY TRADING STRATEGIES (WEEK OF AUG 26-30, 2025)
**MONDAY, AUGUST 26, 2025**
*# Market Context
*Gann Time Window**: Major turn date (High probability reversal)
*Volume Expected**: Above average due to Monday open
*Key Events**: Watch for gap up/down at open
*# Intraday Strategy
**Pre-Market Analysis (Before 9:30 AM EST)**
*Gap Assessment**:
- Gap Up >23,550: Look for continuation to 23,625
- Gap Down <23,480: Target 23,420 support
*Volume Profile**: Confirm with higher volume for gap sustainability
**Morning Session (9:30 AM - 12:00 PM EST)**
**Setup 1: Breakout Play**
*Entry**: Break above 23,580 with volume
*Stop Loss**: 23,530
*Target 1**: 23,625
*Target 2**: 23,690
*Risk/Reward**: 1:1.8
**Setup 2: Support Bounce**
*Entry**: Bounce from 23,450-23,465 zone
*Stop Loss**: 23,420
*Target 1**: 23,520
*Target 2**: 23,580
*Risk/Reward**: 1:2.6
**Afternoon Session (12:00 PM - 4:00 PM EST)**
**Setup 3: Range Trading**
*Buy Zone**: 23,465-23,485
*Sell Zone**: 23,565-23,585
*Stops**: Outside range by 25 points
*Scalping Opportunity**: 5-15 minute timeframes
**Daily Risk Management**
*Max Risk**: 2% of account
*Position Size**: Adjust for increased volatility (Gann date)
*News Watch**: Fed officials' speeches, tech earnings
---
**TUESDAY, AUGUST 27, 2025**
*# Market Context
*Technical Focus**: Follow-through from Monday's action
*Volatility**: Expected to decrease from Monday
*Pattern Completion**: Watch for harmonic pattern triggers
*# Intraday Strategy
** **Pre-Market Setup**
*Trend Continuation**: If Monday bullish, look for higher lows
*Reversal Signs**: If Monday bearish, watch for oversold bounce
** **Trading Sessions**
**Setup 1: Trend Following**
*Bullish Scenario**:
- Entry: Pullback to 23,500-23,520
- Stop: 23,465
- Targets: 23,625, 23,700
*Bearish Scenario**:
- Entry: Rally to 23,540-23,560
- Stop: 23,590
- Targets: 23,450, 23,380
**Setup 2: Wyckoff Spring/Upthrust**
*Spring Play**: False break below 23,420, quick reversal
*Upthrust Play**: False break above 23,640, quick rejection
*High probability setups with tight stops**
---
**WEDNESDAY, AUGUST 28, 2025**
*# Market Context
*Mid-week Dynamics**: Typically consolidation day
*Technical Pattern**: Triangle/flag pattern completion expected
*Volume**: Usually lower, range-bound trading likely
*# Intraday Strategy
**Setup 1: Breakout Preparation**
*Consolidation Range**: 23,480-23,580
*Volume Spike Required**: For any breakout attempt
*False Breakout Fades**: High probability trades
**Setup 2: Scalping Strategy**
*Timeframe**: 5-15 minutes
*Range**: 23,500-23,550
*Multiple small profits**: 15-25 point targets
*Tight stops**: 10-15 points maximum
---
**THURSDAY, AUGUST 29, 2025**
*# Market Context
*Elliott Wave**: Potential completion of correction wave
*Momentum Building**: For Friday breakout
*Options Activity**: Weekly expiration influence
*# Intraday Strategy
**Setup 1: Pre-Breakout Positioning**
*Accumulation Zone**: 23,450-23,500
*Distribution Zone**: 23,580-23,630
*Position for Friday's move**
**Setup 2: Momentum Trading**
*Morning Gap**: Trade in direction of gap
*Volume Confirmation**: Essential for sustainability
*Extended Targets**: If momentum strong
---
**FRIDAY, AUGUST 30, 2025**
*# Market Context
*Week-End Positioning**: Major moves often occur
*Monthly Close**: Important for larger timeframe analysis
*High Volume Expected**: Options expiration
*# Intraday Strategy
**Setup 1: Weekly Close Play**
*Above 23,580**: Bullish for next week, target 23,700-23,800
*Below 23,450**: Bearish setup, target 23,300-23,200
*Volume Crucial**: For weekly close significance
**Setup 2: Gap & Go/Gap & Reverse**
*Gap Analysis**: Size and volume determine strategy
*Large Gap**: Look for exhaustion and reversal
*Small Gap**: Expect filling and continuation
---
# ⚠️ RISK MANAGEMENT FRAMEWORK
**Position Sizing Formula**
*Conservative**: (Account Size × 1%) ÷ Stop Loss Distance
*Moderate**: (Account Size × 2%) ÷ Stop Loss Distance
*Aggressive**: (Account Size × 3%) ÷ Stop Loss Distance
**Daily Limits**
*Maximum Daily Loss**: 3% of account
*Maximum Positions**: 3 concurrent trades
*Win Rate Target**: >55% (Given R:R ratios)
**Technical Stop Levels**
*5M Chart**: Beyond recent high/low + spread
*15M Chart**: Beyond support/resistance + 15 points
*1H Chart**: Beyond key levels + 25 points
*4H Chart**: Beyond major levels + 40 points
---
# 📈 PROBABILITY MATRIX & SCENARIOS
**Scenario Analysis**
*# **Bull Case (65% Probability)**
*Catalyst**: Break above 23,640 with volume
*Targets**: 24,100 → 24,600 → 25,000
*Timeline**: 2-6 weeks
*Volume Profile**: Above average confirmation needed
**Consolidation Case (25% Probability)**
*Range**: 23,200-23,700
*Duration**: 4-8 weeks
*Pattern**: Triangle or flag formation
*Resolution**: Eventually bullish
**Bear Case (10% Probability)**
*Catalyst**: Break below 23,200 with volume
*Targets**: 22,800 → 22,200 → 21,500
*Timeline**: 3-10 weeks
*Warning Signs**: Distribution volume patterns
---
# 📊 WEEKLY PERFORMANCE TRACKING
**Key Metrics to Monitor**
*Win Rate**: Target >55%
*Average Risk/Reward**: Target >1:2
*Maximum Drawdown**: Limit to 5%
*Sharpe Ratio**: Track risk-adjusted returns
*Best/Worst Days**: Analyze for patterns
**Weekly Review Questions**
1. Were stop losses appropriate for volatility?
2. Did volume confirm price movements?
3. Which timeframe analysis was most accurate?
4. What patterns repeated throughout the week?
5. How did news events impact technical levels?
---
# 🚨 CRITICAL ALERTS & WATCHPOINTS
**Immediate Alerts (Next 24-48 Hours)**
*23,640 Break**: Bullish acceleration likely
*23,420 Break**: Correction deepening
*Volume Spike**: >150% average confirms breakout
*News Flow**: Fed communications, tech earnings
**Weekly Watchpoints**
*Elliott Wave Count**: Validation/invalidation levels
*Harmonic Pattern Completion**: Entry opportunities
*Gann Time Windows**: Reversal probability
*Wyckoff Phases**: Institutional behavior clues
**Monthly Considerations**
*Seasonal Patterns**: September historically weak
*Options Expiration**: Third Friday volatility
*Earnings Season**: Individual stock impacts on index
*Federal Reserve**: Policy meeting outcomes
---
**⚡ FINAL NOTE**: This analysis represents a convergence of multiple technical methodologies. Always combine with fundamental analysis and maintain strict risk management. Market conditions can change rapidly, requiring strategy adjustments.
For those interested in further developing their trading skills based on these types of analyses, consider exploring the mentoring program offered by Shunya dot Trade.(world wide web shunya dot trade)
I welcome your feedback on this analysis, as it will inform and enhance my future work.
Regards,
Shunya.Trade
world wide web shunya dot trade
⚠️ Disclaimer: This post is educational content and does not constitute investment advice, financial advice, or trading recommendations. The views expressed here are based on technical analysis and are shared solely for informational purposes. The stock market is subject to risks, including capital loss, and readers should exercise due diligence before investing. We do not take responsibility for decisions made based on this content. Consult a certified financial advisor for personalized guidance.
**Current Position**: 23,514.5 (Aug 23, 2025, 12:50 AM UTC+4)
* 🎯 Executive Summary
Multi-theory convergence analysis indicates NAS100 at critical inflection point with 65% probability of upward continuation to 24,000-24,600 zone, contingent on breaking 23,640 resistance.
---
# 📊 MULTI-TIMEFRAME TECHNICAL ANALYSIS
**INTRADAY ANALYSIS (5M - 4H)**
**5-Minute Timeframe Analysis**
** Candlestick Patterns
*Current Formation**: Potential inside bar consolidation
*Key Patterns to Watch**: Hammer/Doji near 23,500 (bullish), Shooting star above 23,580 (bearish)
*Volume Confirmation**: Required for breakout validation
** Technical Indicators
*RSI(14)**: ~48-52 (Neutral zone, watch for divergence)
*VWAP**: 23,508 ± 15 (Dynamic S/R level)
*Bollinger Bands**: Squeeze pattern suggesting breakout imminent
*EMA(20)**: 23,495 (immediate support/resistance)
**15-Minute Timeframe Analysis**
** Harmonic Patterns
*Active Pattern**: Potential ABCD completion at 23,350-23,380
*Butterfly Pattern**: Target projection 24,580-24,650
*Fibonacci Confluence**: 61.8% retracement at 23,420
** Wyckoff Analysis
*Phase**: Testing phase after potential accumulation
*Volume**: Decreasing on declines (bullish sign)
*Price Action**: Higher lows formation developing
*Next Expected**: Markup phase if 23,450 holds
**30-Minute Timeframe Analysis**
** Elliott Wave Count
*Primary Count**: Wave (4) correction nearing completion
- Wave A: 23,690 → 23,350
- Wave B: 23,350 → 23,580 (current)
- Wave C Target: 23,200-23,300
*Alternate Count**: Wave (5) impulse beginning
- Target: 24,200-24,600
** W.D. Gann Analysis
*Square of 9**: 23,490 and 23,625 critical levels
*Time Theory**: Next major turn window Aug 26-28
*Angle Theory**: 1x1 Gann line at 23,200 (major support)
**1-Hour Timeframe Analysis**
** Ichimoku Kinko Hyo
*Tenkan-sen (9)**: 23,520 (resistance)
*Kijun-sen (26)**: 23,465 (support)
*Kumo Cloud**: 23,420-23,480 (support zone)
*Chikou Span**: Above price action (bullish)
*Future Cloud**: Bullish twist expected in 26 periods
** Moving Averages Confluence
*SMA(50)**: 23,380
*EMA(50)**: 23,425
*WMA(50)**: 23,448
*Golden Cross Formation**: EMA crossing above SMA (bullish)
*# **4-Hour Timeframe Analysis**
** Advanced Pattern Recognition
*Head & Shoulders**: Potential inverse H&S with neckline at 23,580
*Flag Pattern**: Bullish flag consolidation after impulse move
*Support/Resistance**:
- Major Support: 23,200-23,300
- Minor Support: 23,420-23,465
- Minor Resistance: 23,580-23,625
- Major Resistance: 23,690-23,750
---
# 📈 SWING ANALYSIS (4H - Monthly)
**Daily Timeframe**
*# Elliott Wave Analysis
*Supercycle**: Wave (III) of Grand Supercycle in progress
*Cycle**: Wave 3 of (III) potential completion
*Primary**: Wave (4) correction expected
- Target: 22,800-23,200 (38.2%-50% Fibonacci)
- Duration: 3-8 weeks
- Pattern: Likely flat or triangle
*# Wyckoff Market Structure
*Phase**: Distribution testing vs. Reaccumulation
*Volume Profile**: High volume nodes at 23,300 and 22,800
*Composite Man Activity**: Accumulation signs if above 23,200
*Spring/Upthrust**: Watch for false breakdowns below 23,200
*# Gann Time & Price Forecasting
*Time Cycles**:
- 90-day cycle: Peak expected late August
- 180-day cycle: Next major turn October 2025
*Price Squares**:
- 23,400 = 153² ÷ 10
- 24,000 = 155² ÷ 10
- 25,000 = 158² ÷ 10
**Weekly Timeframe**
*# Long-term Elliott Wave
*Grand Supercycle**: Wave III from 2009 lows
*Supercycle**: Wave (3) extension phase
*Cycle**: Wave 3 of (3) nearing completion at 25,000-26,000
*# Harmonic Analysis
*Shark Pattern**: Completion at 25,200-25,400
*Crab Pattern**: Deep retracement target 20,800-21,500
*ABCD Extensions**: 1.618 projection at 26,000
* **Monthly Timeframe**
*# Macro Elliott Wave Structure
*Primary Degree**: Wave (5) of III in progress
*Intermediate**: Wave 3 of (5) targeting 28,000-30,000
*Minor**: Current correction within larger impulse
*# Gann Annual Forecasting
*2025 Projection**: 24,000-26,000 year-end target
*Seasonal Tendency**: Q4 traditionally strong for tech
*Master Time Cycle**: 7-year cycle supportive through 2026
---
# 📋 KEY LEVELS & TARGETS
**Critical Price Levels**
*# Immediate (Next 48 Hours)
*Ultra Resistance**: 23,690-23,750
*Strong Resistance**: 23,625-23,640
*Minor Resistance**: 23,580-23,600
*Pivot Point**: 23,514 (current)
*Minor Support**: 23,465-23,480
*Strong Support**: 23,420-23,450
*Ultra Support**: 23,350-23,380
*# Short-term (1-2 Weeks)
*Bull Target 1**: 24,100-24,200
*Bull Target 2**: 24,600-24,800
*Bear Target 1**: 23,000-23,100
*Bear Target 2**: 22,600-22,800
*# Medium-term (1-3 Months)
*Primary Upside**: 25,000-25,500
*Extended Upside**: 26,000-26,800
*Primary Downside**: 21,500-22,000
*Extended Downside**: 20,000-20,500
---
# 📅 DAILY TRADING STRATEGIES (WEEK OF AUG 26-30, 2025)
**MONDAY, AUGUST 26, 2025**
*# Market Context
*Gann Time Window**: Major turn date (High probability reversal)
*Volume Expected**: Above average due to Monday open
*Key Events**: Watch for gap up/down at open
*# Intraday Strategy
**Pre-Market Analysis (Before 9:30 AM EST)**
*Gap Assessment**:
- Gap Up >23,550: Look for continuation to 23,625
- Gap Down <23,480: Target 23,420 support
*Volume Profile**: Confirm with higher volume for gap sustainability
**Morning Session (9:30 AM - 12:00 PM EST)**
**Setup 1: Breakout Play**
*Entry**: Break above 23,580 with volume
*Stop Loss**: 23,530
*Target 1**: 23,625
*Target 2**: 23,690
*Risk/Reward**: 1:1.8
**Setup 2: Support Bounce**
*Entry**: Bounce from 23,450-23,465 zone
*Stop Loss**: 23,420
*Target 1**: 23,520
*Target 2**: 23,580
*Risk/Reward**: 1:2.6
**Afternoon Session (12:00 PM - 4:00 PM EST)**
**Setup 3: Range Trading**
*Buy Zone**: 23,465-23,485
*Sell Zone**: 23,565-23,585
*Stops**: Outside range by 25 points
*Scalping Opportunity**: 5-15 minute timeframes
**Daily Risk Management**
*Max Risk**: 2% of account
*Position Size**: Adjust for increased volatility (Gann date)
*News Watch**: Fed officials' speeches, tech earnings
---
**TUESDAY, AUGUST 27, 2025**
*# Market Context
*Technical Focus**: Follow-through from Monday's action
*Volatility**: Expected to decrease from Monday
*Pattern Completion**: Watch for harmonic pattern triggers
*# Intraday Strategy
** **Pre-Market Setup**
*Trend Continuation**: If Monday bullish, look for higher lows
*Reversal Signs**: If Monday bearish, watch for oversold bounce
** **Trading Sessions**
**Setup 1: Trend Following**
*Bullish Scenario**:
- Entry: Pullback to 23,500-23,520
- Stop: 23,465
- Targets: 23,625, 23,700
*Bearish Scenario**:
- Entry: Rally to 23,540-23,560
- Stop: 23,590
- Targets: 23,450, 23,380
**Setup 2: Wyckoff Spring/Upthrust**
*Spring Play**: False break below 23,420, quick reversal
*Upthrust Play**: False break above 23,640, quick rejection
*High probability setups with tight stops**
---
**WEDNESDAY, AUGUST 28, 2025**
*# Market Context
*Mid-week Dynamics**: Typically consolidation day
*Technical Pattern**: Triangle/flag pattern completion expected
*Volume**: Usually lower, range-bound trading likely
*# Intraday Strategy
**Setup 1: Breakout Preparation**
*Consolidation Range**: 23,480-23,580
*Volume Spike Required**: For any breakout attempt
*False Breakout Fades**: High probability trades
**Setup 2: Scalping Strategy**
*Timeframe**: 5-15 minutes
*Range**: 23,500-23,550
*Multiple small profits**: 15-25 point targets
*Tight stops**: 10-15 points maximum
---
**THURSDAY, AUGUST 29, 2025**
*# Market Context
*Elliott Wave**: Potential completion of correction wave
*Momentum Building**: For Friday breakout
*Options Activity**: Weekly expiration influence
*# Intraday Strategy
**Setup 1: Pre-Breakout Positioning**
*Accumulation Zone**: 23,450-23,500
*Distribution Zone**: 23,580-23,630
*Position for Friday's move**
**Setup 2: Momentum Trading**
*Morning Gap**: Trade in direction of gap
*Volume Confirmation**: Essential for sustainability
*Extended Targets**: If momentum strong
---
**FRIDAY, AUGUST 30, 2025**
*# Market Context
*Week-End Positioning**: Major moves often occur
*Monthly Close**: Important for larger timeframe analysis
*High Volume Expected**: Options expiration
*# Intraday Strategy
**Setup 1: Weekly Close Play**
*Above 23,580**: Bullish for next week, target 23,700-23,800
*Below 23,450**: Bearish setup, target 23,300-23,200
*Volume Crucial**: For weekly close significance
**Setup 2: Gap & Go/Gap & Reverse**
*Gap Analysis**: Size and volume determine strategy
*Large Gap**: Look for exhaustion and reversal
*Small Gap**: Expect filling and continuation
---
# ⚠️ RISK MANAGEMENT FRAMEWORK
**Position Sizing Formula**
*Conservative**: (Account Size × 1%) ÷ Stop Loss Distance
*Moderate**: (Account Size × 2%) ÷ Stop Loss Distance
*Aggressive**: (Account Size × 3%) ÷ Stop Loss Distance
**Daily Limits**
*Maximum Daily Loss**: 3% of account
*Maximum Positions**: 3 concurrent trades
*Win Rate Target**: >55% (Given R:R ratios)
**Technical Stop Levels**
*5M Chart**: Beyond recent high/low + spread
*15M Chart**: Beyond support/resistance + 15 points
*1H Chart**: Beyond key levels + 25 points
*4H Chart**: Beyond major levels + 40 points
---
# 📈 PROBABILITY MATRIX & SCENARIOS
**Scenario Analysis**
*# **Bull Case (65% Probability)**
*Catalyst**: Break above 23,640 with volume
*Targets**: 24,100 → 24,600 → 25,000
*Timeline**: 2-6 weeks
*Volume Profile**: Above average confirmation needed
**Consolidation Case (25% Probability)**
*Range**: 23,200-23,700
*Duration**: 4-8 weeks
*Pattern**: Triangle or flag formation
*Resolution**: Eventually bullish
**Bear Case (10% Probability)**
*Catalyst**: Break below 23,200 with volume
*Targets**: 22,800 → 22,200 → 21,500
*Timeline**: 3-10 weeks
*Warning Signs**: Distribution volume patterns
---
# 📊 WEEKLY PERFORMANCE TRACKING
**Key Metrics to Monitor**
*Win Rate**: Target >55%
*Average Risk/Reward**: Target >1:2
*Maximum Drawdown**: Limit to 5%
*Sharpe Ratio**: Track risk-adjusted returns
*Best/Worst Days**: Analyze for patterns
**Weekly Review Questions**
1. Were stop losses appropriate for volatility?
2. Did volume confirm price movements?
3. Which timeframe analysis was most accurate?
4. What patterns repeated throughout the week?
5. How did news events impact technical levels?
---
# 🚨 CRITICAL ALERTS & WATCHPOINTS
**Immediate Alerts (Next 24-48 Hours)**
*23,640 Break**: Bullish acceleration likely
*23,420 Break**: Correction deepening
*Volume Spike**: >150% average confirms breakout
*News Flow**: Fed communications, tech earnings
**Weekly Watchpoints**
*Elliott Wave Count**: Validation/invalidation levels
*Harmonic Pattern Completion**: Entry opportunities
*Gann Time Windows**: Reversal probability
*Wyckoff Phases**: Institutional behavior clues
**Monthly Considerations**
*Seasonal Patterns**: September historically weak
*Options Expiration**: Third Friday volatility
*Earnings Season**: Individual stock impacts on index
*Federal Reserve**: Policy meeting outcomes
---
**⚡ FINAL NOTE**: This analysis represents a convergence of multiple technical methodologies. Always combine with fundamental analysis and maintain strict risk management. Market conditions can change rapidly, requiring strategy adjustments.
For those interested in further developing their trading skills based on these types of analyses, consider exploring the mentoring program offered by Shunya dot Trade.(world wide web shunya dot trade)
I welcome your feedback on this analysis, as it will inform and enhance my future work.
Regards,
Shunya.Trade
world wide web shunya dot trade
⚠️ Disclaimer: This post is educational content and does not constitute investment advice, financial advice, or trading recommendations. The views expressed here are based on technical analysis and are shared solely for informational purposes. The stock market is subject to risks, including capital loss, and readers should exercise due diligence before investing. We do not take responsibility for decisions made based on this content. Consult a certified financial advisor for personalized guidance.
I am nothing @shunya.trade
Pernyataan Penyangkalan
Informasi dan publikasi tidak dimaksudkan untuk menjadi, dan bukan merupakan saran keuangan, investasi, perdagangan, atau rekomendasi lainnya yang diberikan atau didukung oleh TradingView. Baca selengkapnya di Persyaratan Penggunaan.
I am nothing @shunya.trade
Pernyataan Penyangkalan
Informasi dan publikasi tidak dimaksudkan untuk menjadi, dan bukan merupakan saran keuangan, investasi, perdagangan, atau rekomendasi lainnya yang diberikan atau didukung oleh TradingView. Baca selengkapnya di Persyaratan Penggunaan.