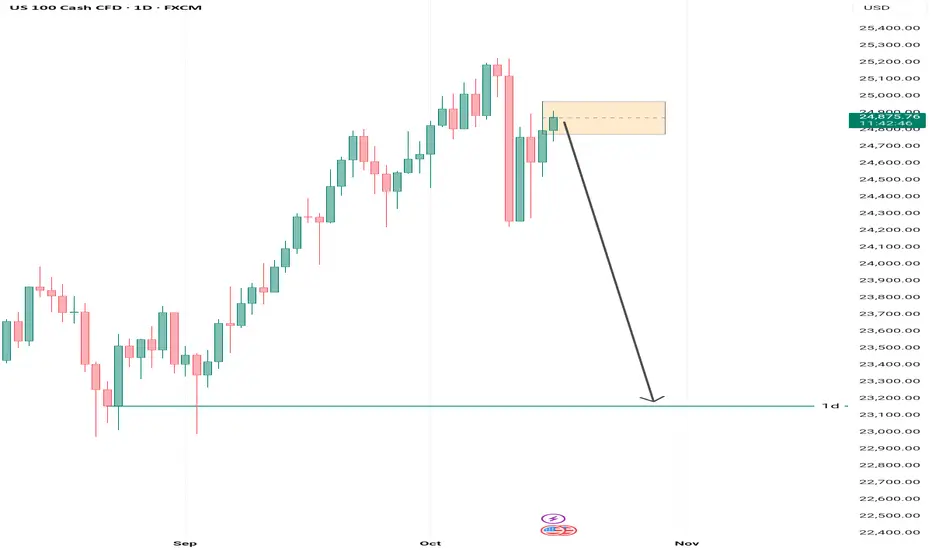
Based on the breakout observed on the 4-hour timeframe and its confirmation on the 30-minute chart — which itself was validated by the M5 structure break within the highlighted golden zone — we expect the price to continue its decline toward the first daily support level.
This setup provides a strong risk-to-reward ratio, as illustrated on the chart.
As always — stay patient, follow your plan, and trust your analysis.
Pernyataan Penyangkalan
Informasi dan publikasi ini tidak dimaksudkan, dan bukan merupakan, saran atau rekomendasi keuangan, investasi, trading, atau jenis lainnya yang diberikan atau didukung oleh TradingView. Baca selengkapnya di Ketentuan Penggunaan.
Pernyataan Penyangkalan
Informasi dan publikasi ini tidak dimaksudkan, dan bukan merupakan, saran atau rekomendasi keuangan, investasi, trading, atau jenis lainnya yang diberikan atau didukung oleh TradingView. Baca selengkapnya di Ketentuan Penggunaan.