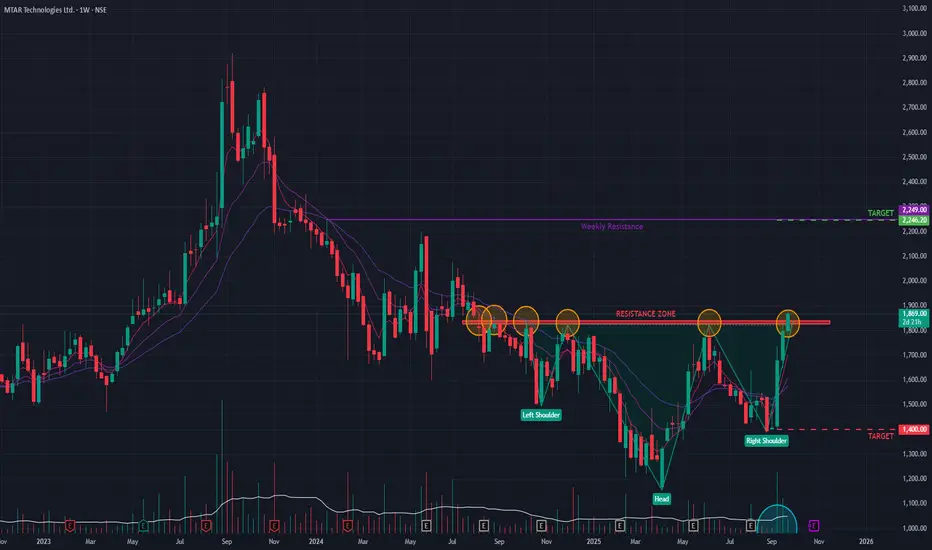
MTAR Tech has shown a significant sign of a potential long-term trend reversal. The stock, which has been in a prolonged downtrend since its All-Time High in September 2023, has decisively broken out of an Inverse Head & Shoulders pattern on the weekly chart today.
This classic bullish reversal pattern was confirmed by a strong upward move that breached the neckline, supported by decent trading volume.
Multi-Timeframe Confirmation 👍
The bullish thesis is strongly supported by momentum indicators across all major timeframes:
- Broad Momentum: The Relative Strength Index (RSI) is in a bullish crossover state on the monthly, weekly, and daily charts, indicating synchronized positive momentum.
- Volume Trend: The general trend of building volume suggests increasing buyer participation and conviction in the upward move.
Future Outlook and Key Levels
The breakout from this major reversal pattern suggests the downtrend that began in mid-2023 may be over. The price action in the coming days will be crucial for confirmation.
- Bullish Case 📈: If the breakout momentum is sustained, the stock could be on a path toward the next major resistance level near ₹2,245.
- Bearish Case 📉: However, if the breakout fails to hold and momentum wanes, the stock could pull back to test support around the ₹1,400 level.
Disclaimer: This analysis is my personal view & for educational purposes only. They shall not be construed as trade or investment advice. Before making any financial decision, it is imperative that you consult with a qualified financial professional.
Pernyataan Penyangkalan
Informasi dan publikasi ini tidak dimaksudkan, dan bukan merupakan, saran atau rekomendasi keuangan, investasi, trading, atau jenis lainnya yang diberikan atau didukung oleh TradingView. Baca selengkapnya di Ketentuan Penggunaan.