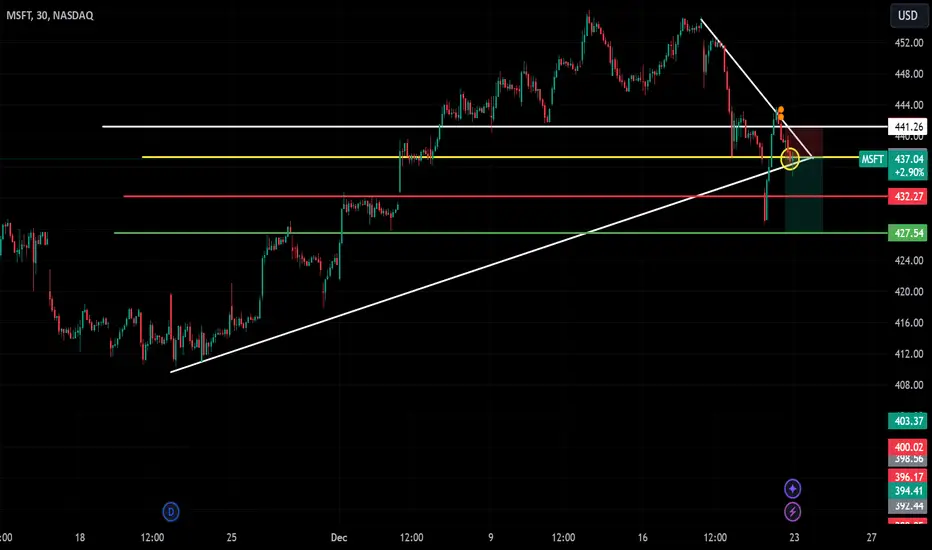
📉 Entry: $437.04 – Price action shows rejection at a resistance level, confirming bearish momentum. 🚨
Stop Loss: $441.26 – Protect against invalidation above this resistance. ✋
🎯 Targets:
T1: $432.27 – Immediate support and first profit zone. 🛑
T2: $427.54 – Extended downside target for further profits. 💰
Key Details:
📊 The breakdown below the ascending trendline confirms weakening bullish momentum.
📉 Price rejection near $437.04 signals a high-probability short trade opportunity with a favorable risk-reward ratio.
📌 Strategy:
🔻 Enter short at $437.04.
🔒 SL above $441.26.
✅ Take profits at $432.27 (T1) & $427.54 (T2).
Why This Chart is Important:
⚠️ MSFT’s price action highlights a clear bearish breakdown, offering an ideal setup for short trades.
Conclusion:
Rejection at $437.04, combined with downside targets at $432.27 and $427.54, confirms bearish momentum for this setup. 📉🔥
#Trading #MSFT #StockMarket #BearishSetup #RiskReward #StockAnalysis #ProfittoPath
Pernyataan Penyangkalan
Informasi dan publikasi tidak dimaksudkan untuk menjadi, dan bukan merupakan saran keuangan, investasi, perdagangan, atau rekomendasi lainnya yang diberikan atau didukung oleh TradingView. Baca selengkapnya di Persyaratan Penggunaan.
Pernyataan Penyangkalan
Informasi dan publikasi tidak dimaksudkan untuk menjadi, dan bukan merupakan saran keuangan, investasi, perdagangan, atau rekomendasi lainnya yang diberikan atau didukung oleh TradingView. Baca selengkapnya di Persyaratan Penggunaan.