📈 1-Hour Timeframe Technical Overview
Trend: The stock is exhibiting a bullish trend on the 1-hour chart, characterized by higher highs and higher lows.
Resistance Levels:
Immediate Resistance: ₹70.
Key Resistance: ₹75.
Support Levels:
Immediate Support: ₹65.
Key Support: ₹62.
Pivot Points:
Central Pivot: ₹64.84
Resistance (R1): ₹66.13
Support (S1): ₹63.55
🔧 Technical Indicators
RSI (Relative Strength Index): Currently neutral, indicating no overbought or oversold conditions.
Moving Averages:
50-period EMA: Trending upwards, supporting the bullish momentum.
200-period EMA: Also trending upwards, confirming the long-term bullish trend.
MACD (Moving Average Convergence Divergence): The MACD line is above the signal line, suggesting bullish momentum.
Volume: Increasing volume on upward movements indicates strong buying interest.
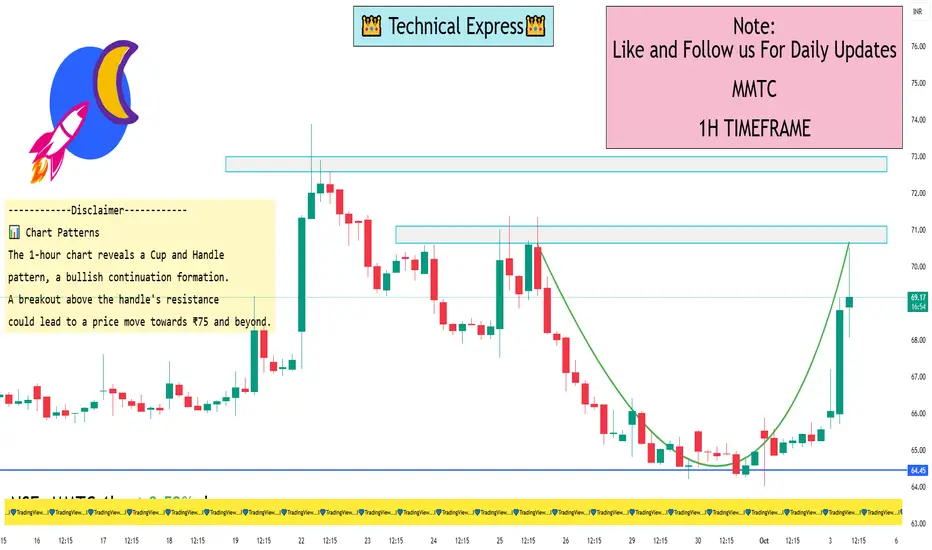
📊 Chart Patterns
The 1-hour chart reveals a Cup and Handle pattern, a bullish continuation formation. A breakout above the handle's resistance could lead to a price move towards ₹75 and beyond.
✅ Summary
MMTC Ltd is showing bullish signals on the 1-hour chart, with key resistance at ₹70 and ₹75, and support at ₹65 and ₹62. Technical indicators confirm the upward momentum. A breakout above ₹70 could signal further bullish movement.
Trend: The stock is exhibiting a bullish trend on the 1-hour chart, characterized by higher highs and higher lows.
Resistance Levels:
Immediate Resistance: ₹70.
Key Resistance: ₹75.
Support Levels:
Immediate Support: ₹65.
Key Support: ₹62.
Pivot Points:
Central Pivot: ₹64.84
Resistance (R1): ₹66.13
Support (S1): ₹63.55
🔧 Technical Indicators
RSI (Relative Strength Index): Currently neutral, indicating no overbought or oversold conditions.
Moving Averages:
50-period EMA: Trending upwards, supporting the bullish momentum.
200-period EMA: Also trending upwards, confirming the long-term bullish trend.
MACD (Moving Average Convergence Divergence): The MACD line is above the signal line, suggesting bullish momentum.
Volume: Increasing volume on upward movements indicates strong buying interest.
📊 Chart Patterns
The 1-hour chart reveals a Cup and Handle pattern, a bullish continuation formation. A breakout above the handle's resistance could lead to a price move towards ₹75 and beyond.
✅ Summary
MMTC Ltd is showing bullish signals on the 1-hour chart, with key resistance at ₹70 and ₹75, and support at ₹65 and ₹62. Technical indicators confirm the upward momentum. A breakout above ₹70 could signal further bullish movement.
I built a Buy & Sell Signal Indicator with 85% accuracy.
📈 Get access via DM or
WhatsApp: wa.link/d997q0
Contact - +91 76782 40962
| Email: techncialexpress@gmail.com
| Script Coder | Trader | Investor | From India
📈 Get access via DM or
WhatsApp: wa.link/d997q0
Contact - +91 76782 40962
| Email: techncialexpress@gmail.com
| Script Coder | Trader | Investor | From India
Publikasi terkait
Pernyataan Penyangkalan
Informasi dan publikasi ini tidak dimaksudkan, dan bukan merupakan, saran atau rekomendasi keuangan, investasi, trading, atau jenis lainnya yang diberikan atau didukung oleh TradingView. Baca selengkapnya di Ketentuan Penggunaan.