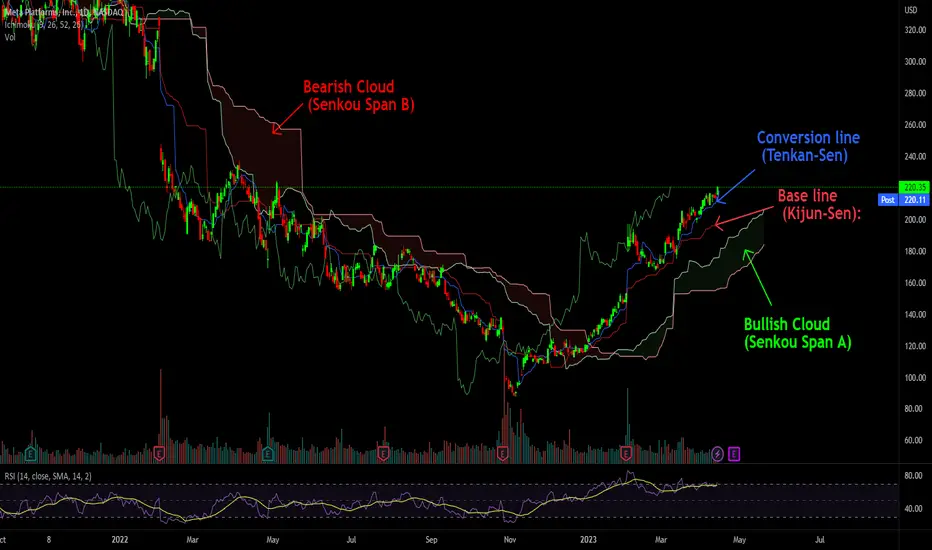
Conversion line (Tenkan-Sen): This is a short-term moving average that measures the average of the highest high and lowest low over the past nine periods. It is used to identify short-term trends in the market. (9-day)
Base line (Kijun-Sen): This is a longer-term moving average that measures the average of the highest high and lowest low over the past 26 periods. It is used to identify longer-term trends in the market. (26-day)
Lagging span (Chikou Span): This is the current closing price, plotted 26 periods behind. It is used to confirm signals given by the conversion line and base line.
Bullish Cloud (Senkou Span A): This is the area between the conversion line and the base line, shaded green on the chart. It represents support and indicates a bullish trend.
Bearish Cloud (Senkou Span B): This is the area between two longer-term moving averages, shaded red on the chart. It represents resistance and indicates a bearish trend.
Publikasi terkait
Pernyataan Penyangkalan
The information and publications are not meant to be, and do not constitute, financial, investment, trading, or other types of advice or recommendations supplied or endorsed by TradingView. Read more in the Terms of Use.
Publikasi terkait
Pernyataan Penyangkalan
The information and publications are not meant to be, and do not constitute, financial, investment, trading, or other types of advice or recommendations supplied or endorsed by TradingView. Read more in the Terms of Use.